Embed Analytics into Your Application
This tutorial will refer to GoodData.UI, our powerful library for building analytical applications powered by GoodData.
You can embed an insight, a dashboard, or even Analytical Designer as a tool for creating insights. You can also create a fully tailored application from individual components of GoodData.UI.
This tutorial requires knowledge of UI application development.
Instead of building an application from scratch, you can use the GoodData.UI interactive code examples.
The comprehensive GoodData.UI documentation is available here.
Embed an Insight
You are going to create a simple web application and embed the insight that you created in the previous tutorial.
Steps:
Start generating the application skeleton with Accelerator Toolkit.
npx @gooddata/create-gooddata-react-app --backend tigerWhen prompted, enter the application name and the hostname where GoodData.CN is exposed.
? What is your application name? gooddata-cn-demo
? Insert your hostname: http://localhost:3000
? What is your application desired flavor?
  JavaScript
❯ TypeScript
The toolkit generates the application skeleton in the directory with the name that you provided and will guide you through the next steps.
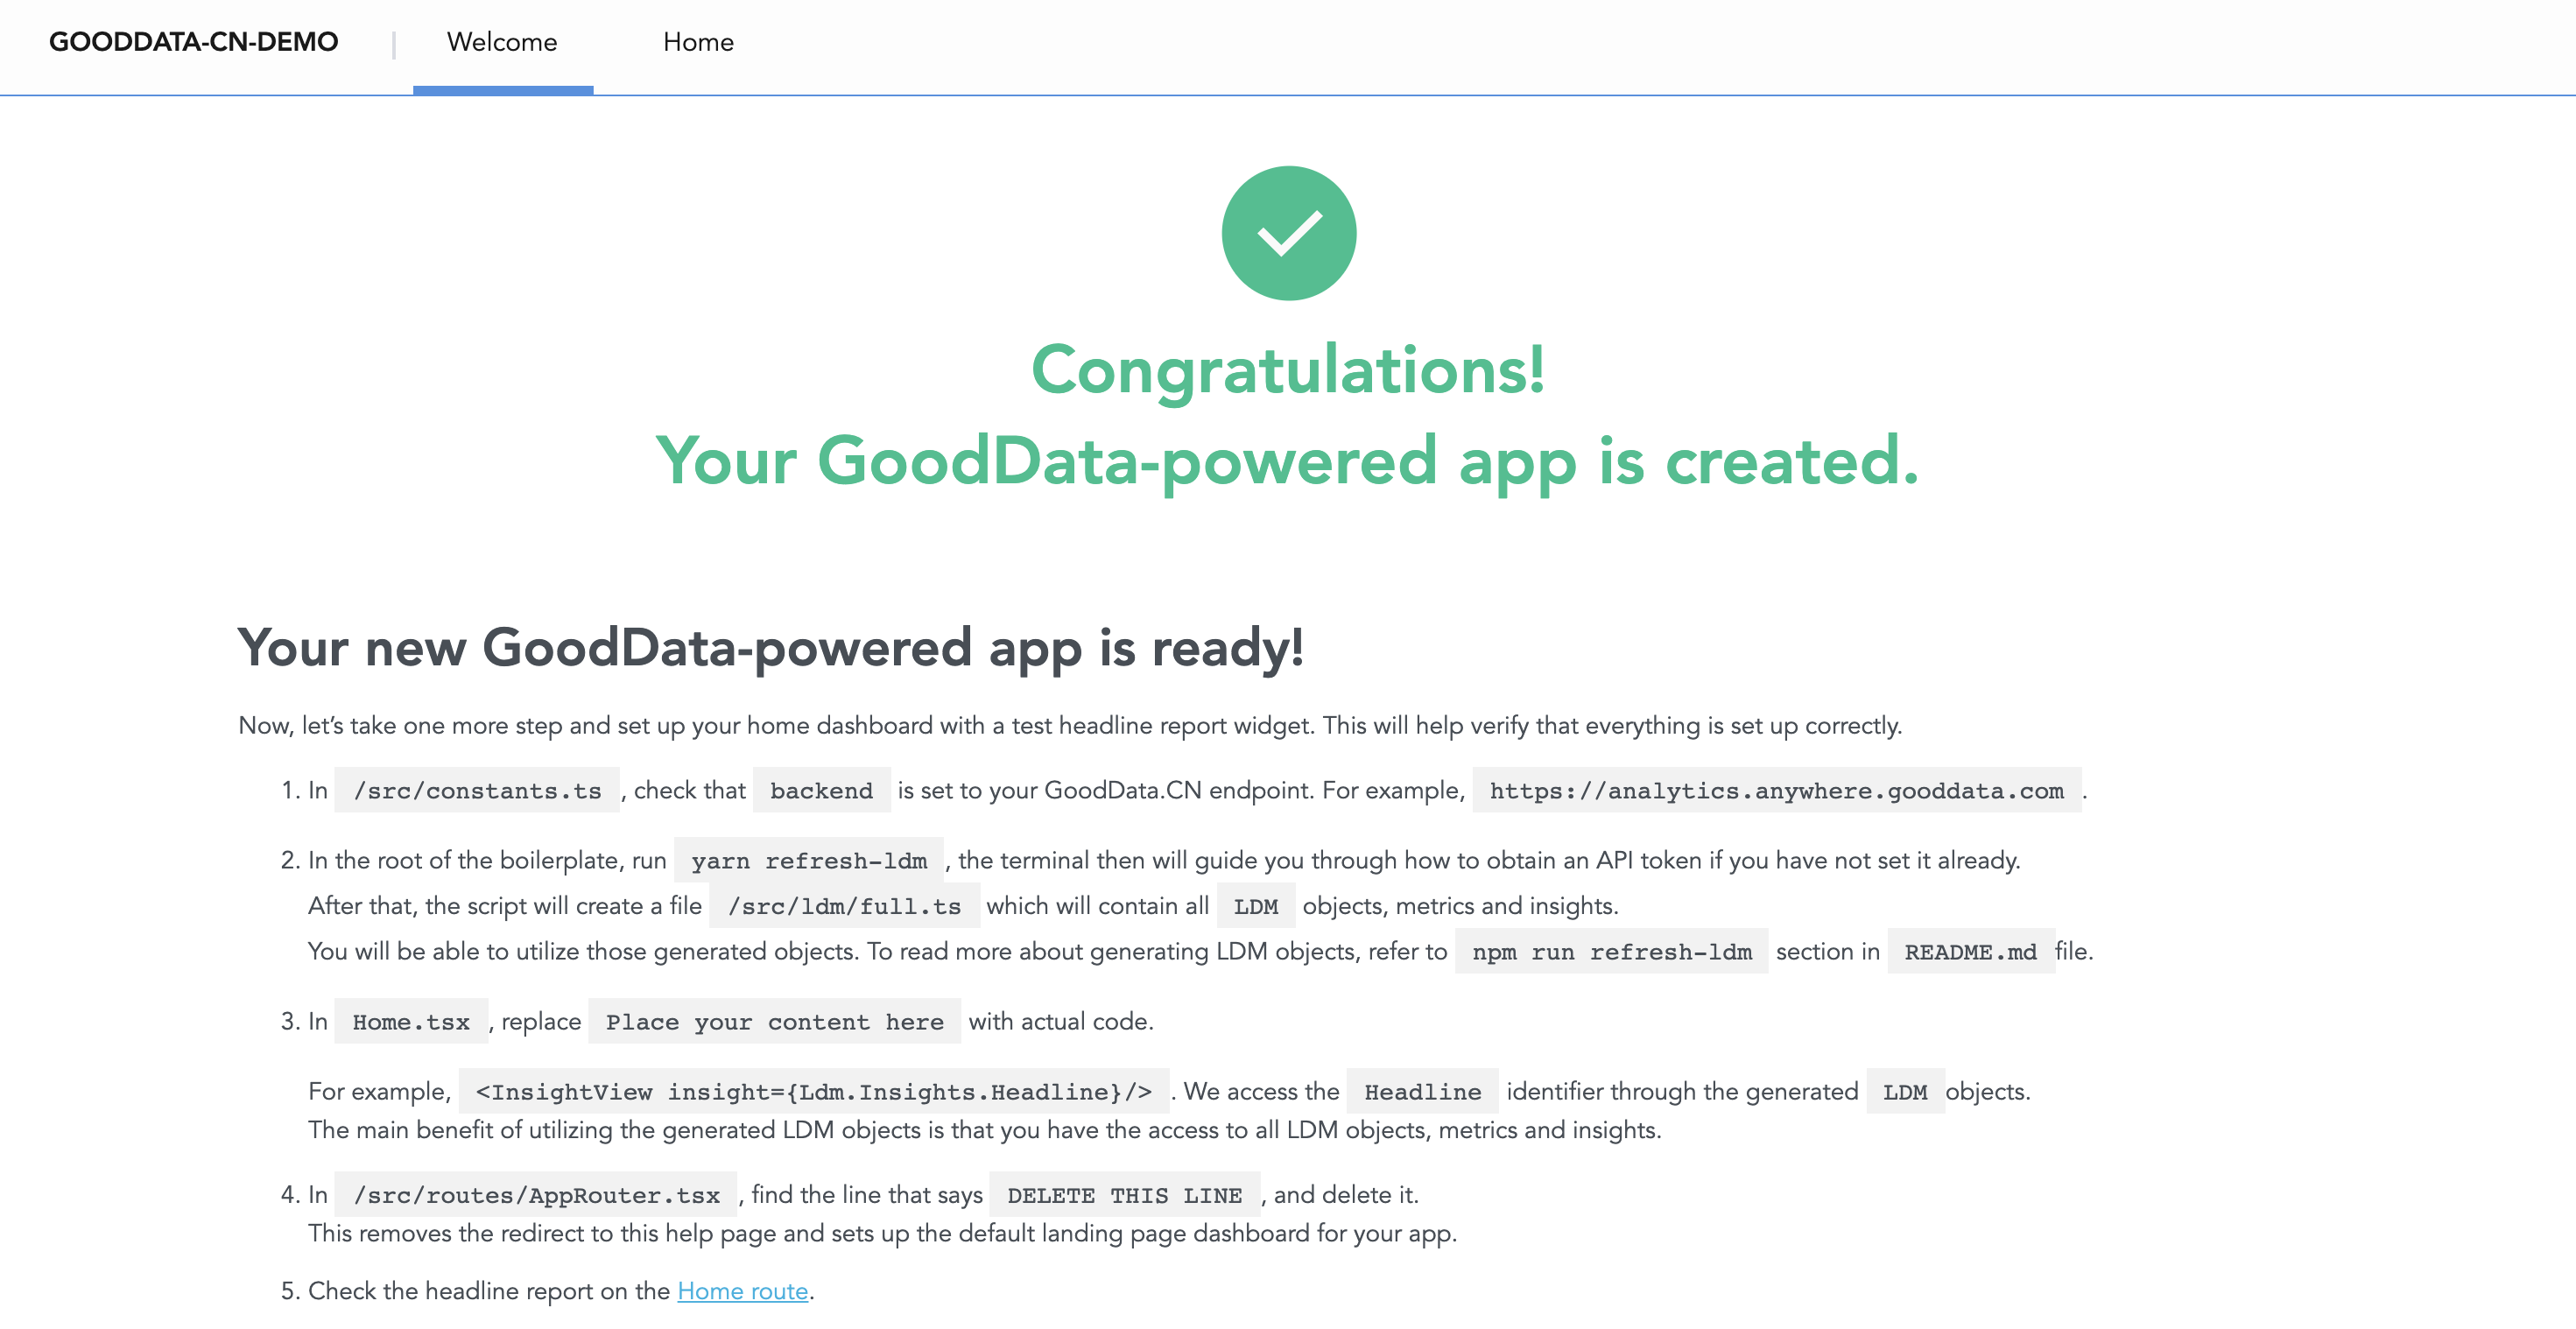
Success! Your GoodData-powered application "gooddata-cn-demo" was created.
You can start it using the following commands:
    cd gooddata-cn-demo
    yarn start
Start the application.
cd gooddata-cn-demo
yarn start
Your browser opens. If port 8443 is empty on the localhost, it will be used by default.
 Running the application this way is intended only for development purposes. It sets your GoodData.CN as a local proxy so that it can be used without setting up CORS.
Provide your workspace identifier in
src/constants.ts.export const workspace = "demo";Load the logical data model and all its entities to the application.
export TIGER_API_TOKEN=YWRtaW46Ym9vdHN0cmFwOmFkbWluMTIz
yarn refresh-ldm
The output similar to the following is generated:
*----------------------------------------------*
|  GoodData Catalog Export Tool v8.3.0  |
*----------------------------------------------*
✔ Catalog loaded
✔ Date data sets loaded
✔ Insights loaded
✔ Analytical dashboards loaded
 ✔ SUCCESS  All data have been successfully exported
*-----------------------------------------------------------------------------------------------------*
|  The result is located at src/ldm/full.ts  |
*-----------------------------------------------------------------------------------------------------*
✨  Done in 2.65s.
Review the
src/ldm/full.tsfile to validate the generated content.Embed the insight into the prepared home page. To do so, open
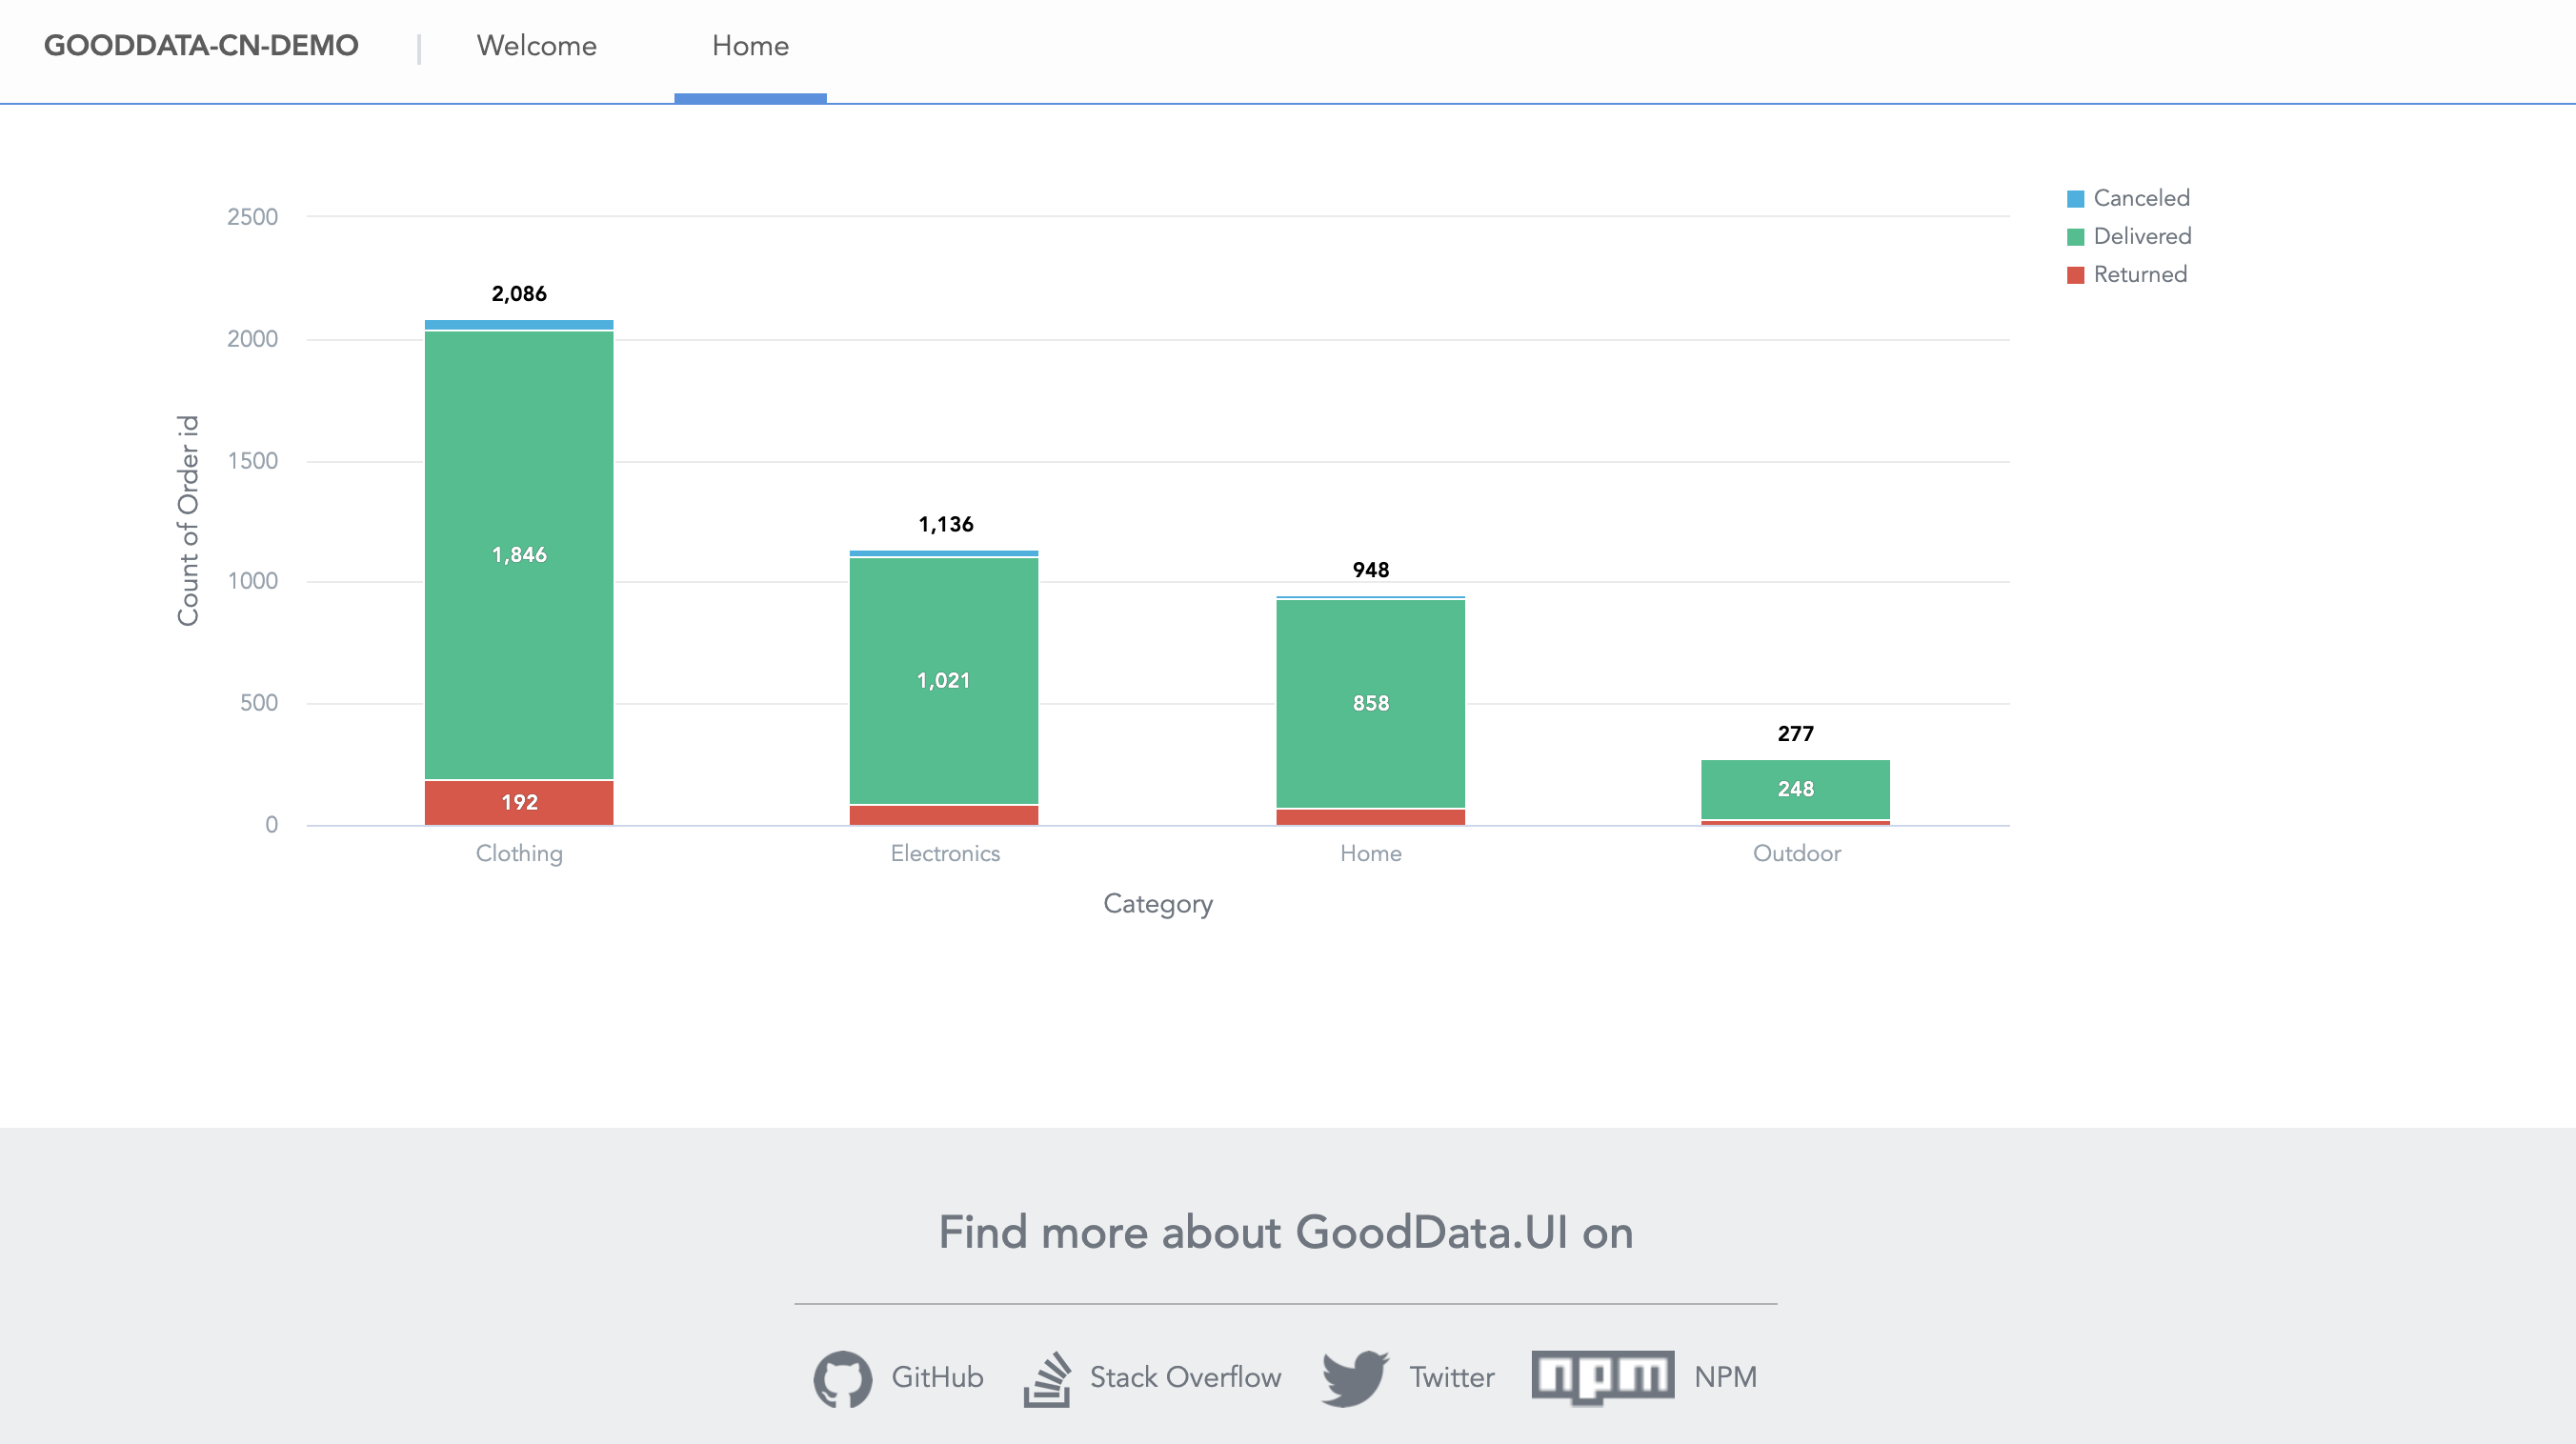
src/routes/Home.tsxand update the content to the following:import React from "react"; import { InsightView } from "@gooddata/sdk-ui-ext"; import Page from "../components/Page"; import { Insights } from "../ldm/full"; const Home = () => { return ( <Page> <InsightView insight={Insights.OrdersByStatusAndCategory} /> </Page> ); }; export default Home;Return to your application in the browser, and click Home in the navigation bar.
The embedded insight opens.
Embed a Dashboard
You are going to embed the dashboard that you created in the previous tutorial.
Steps:
Open the
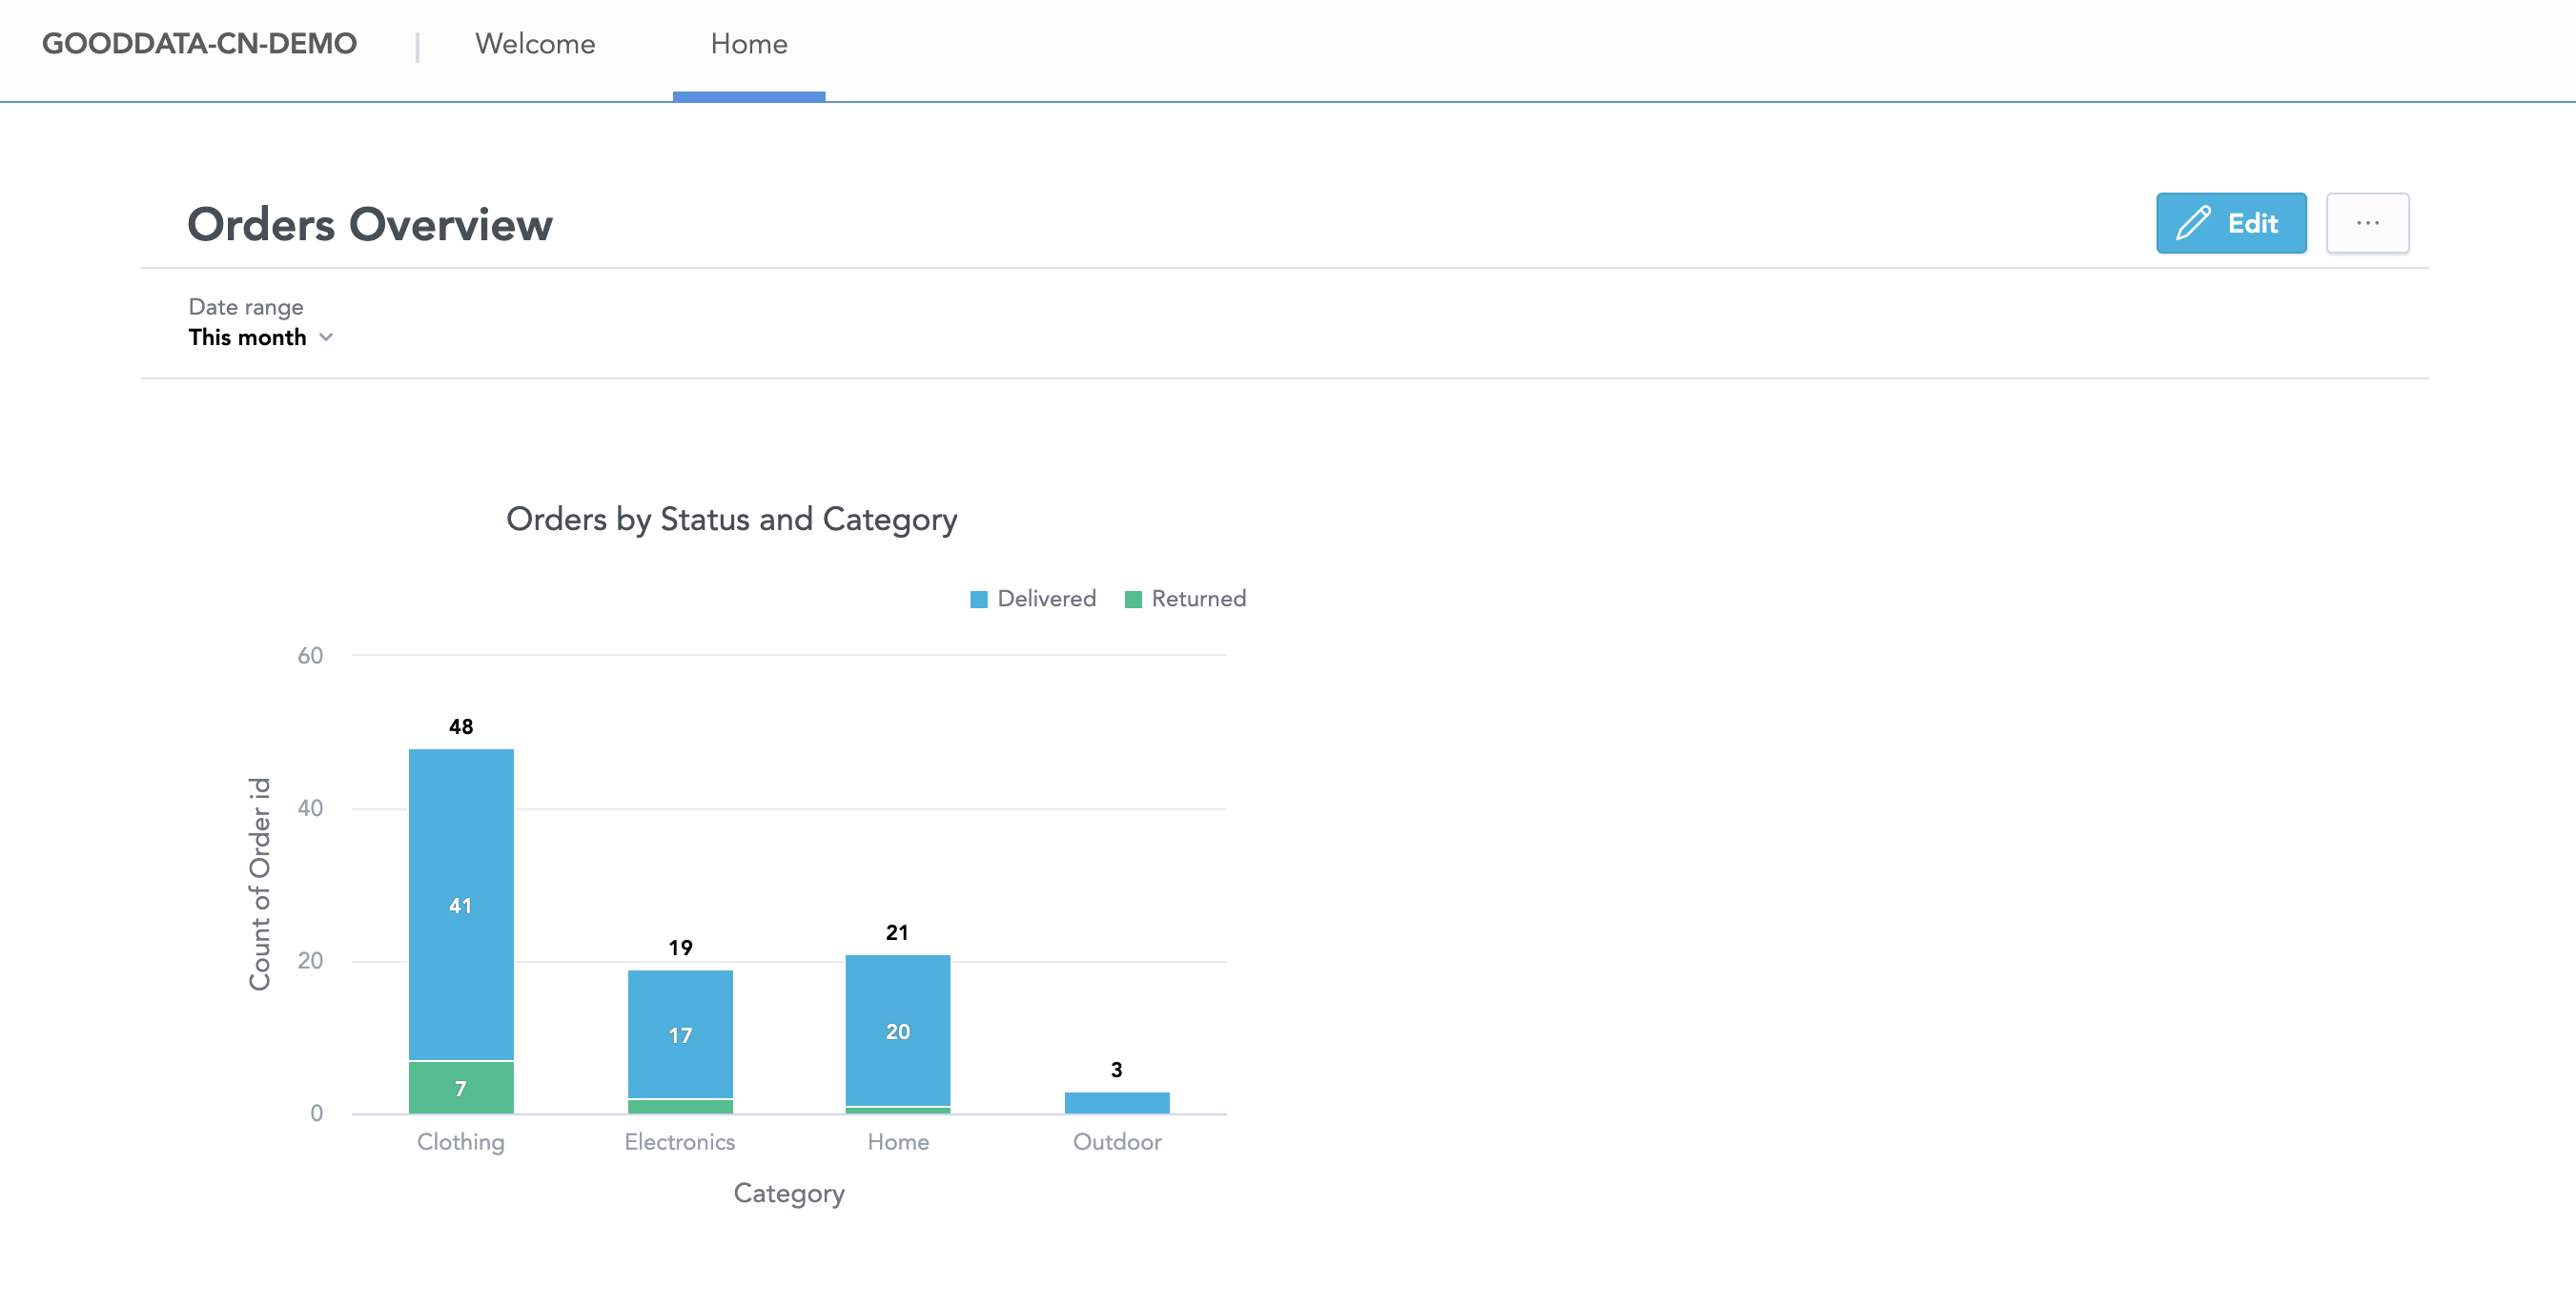
demoworkspace.Click the Dashboards tab.
Click the … button in the top right corner, and click Embed.
The embedding dialog opens.
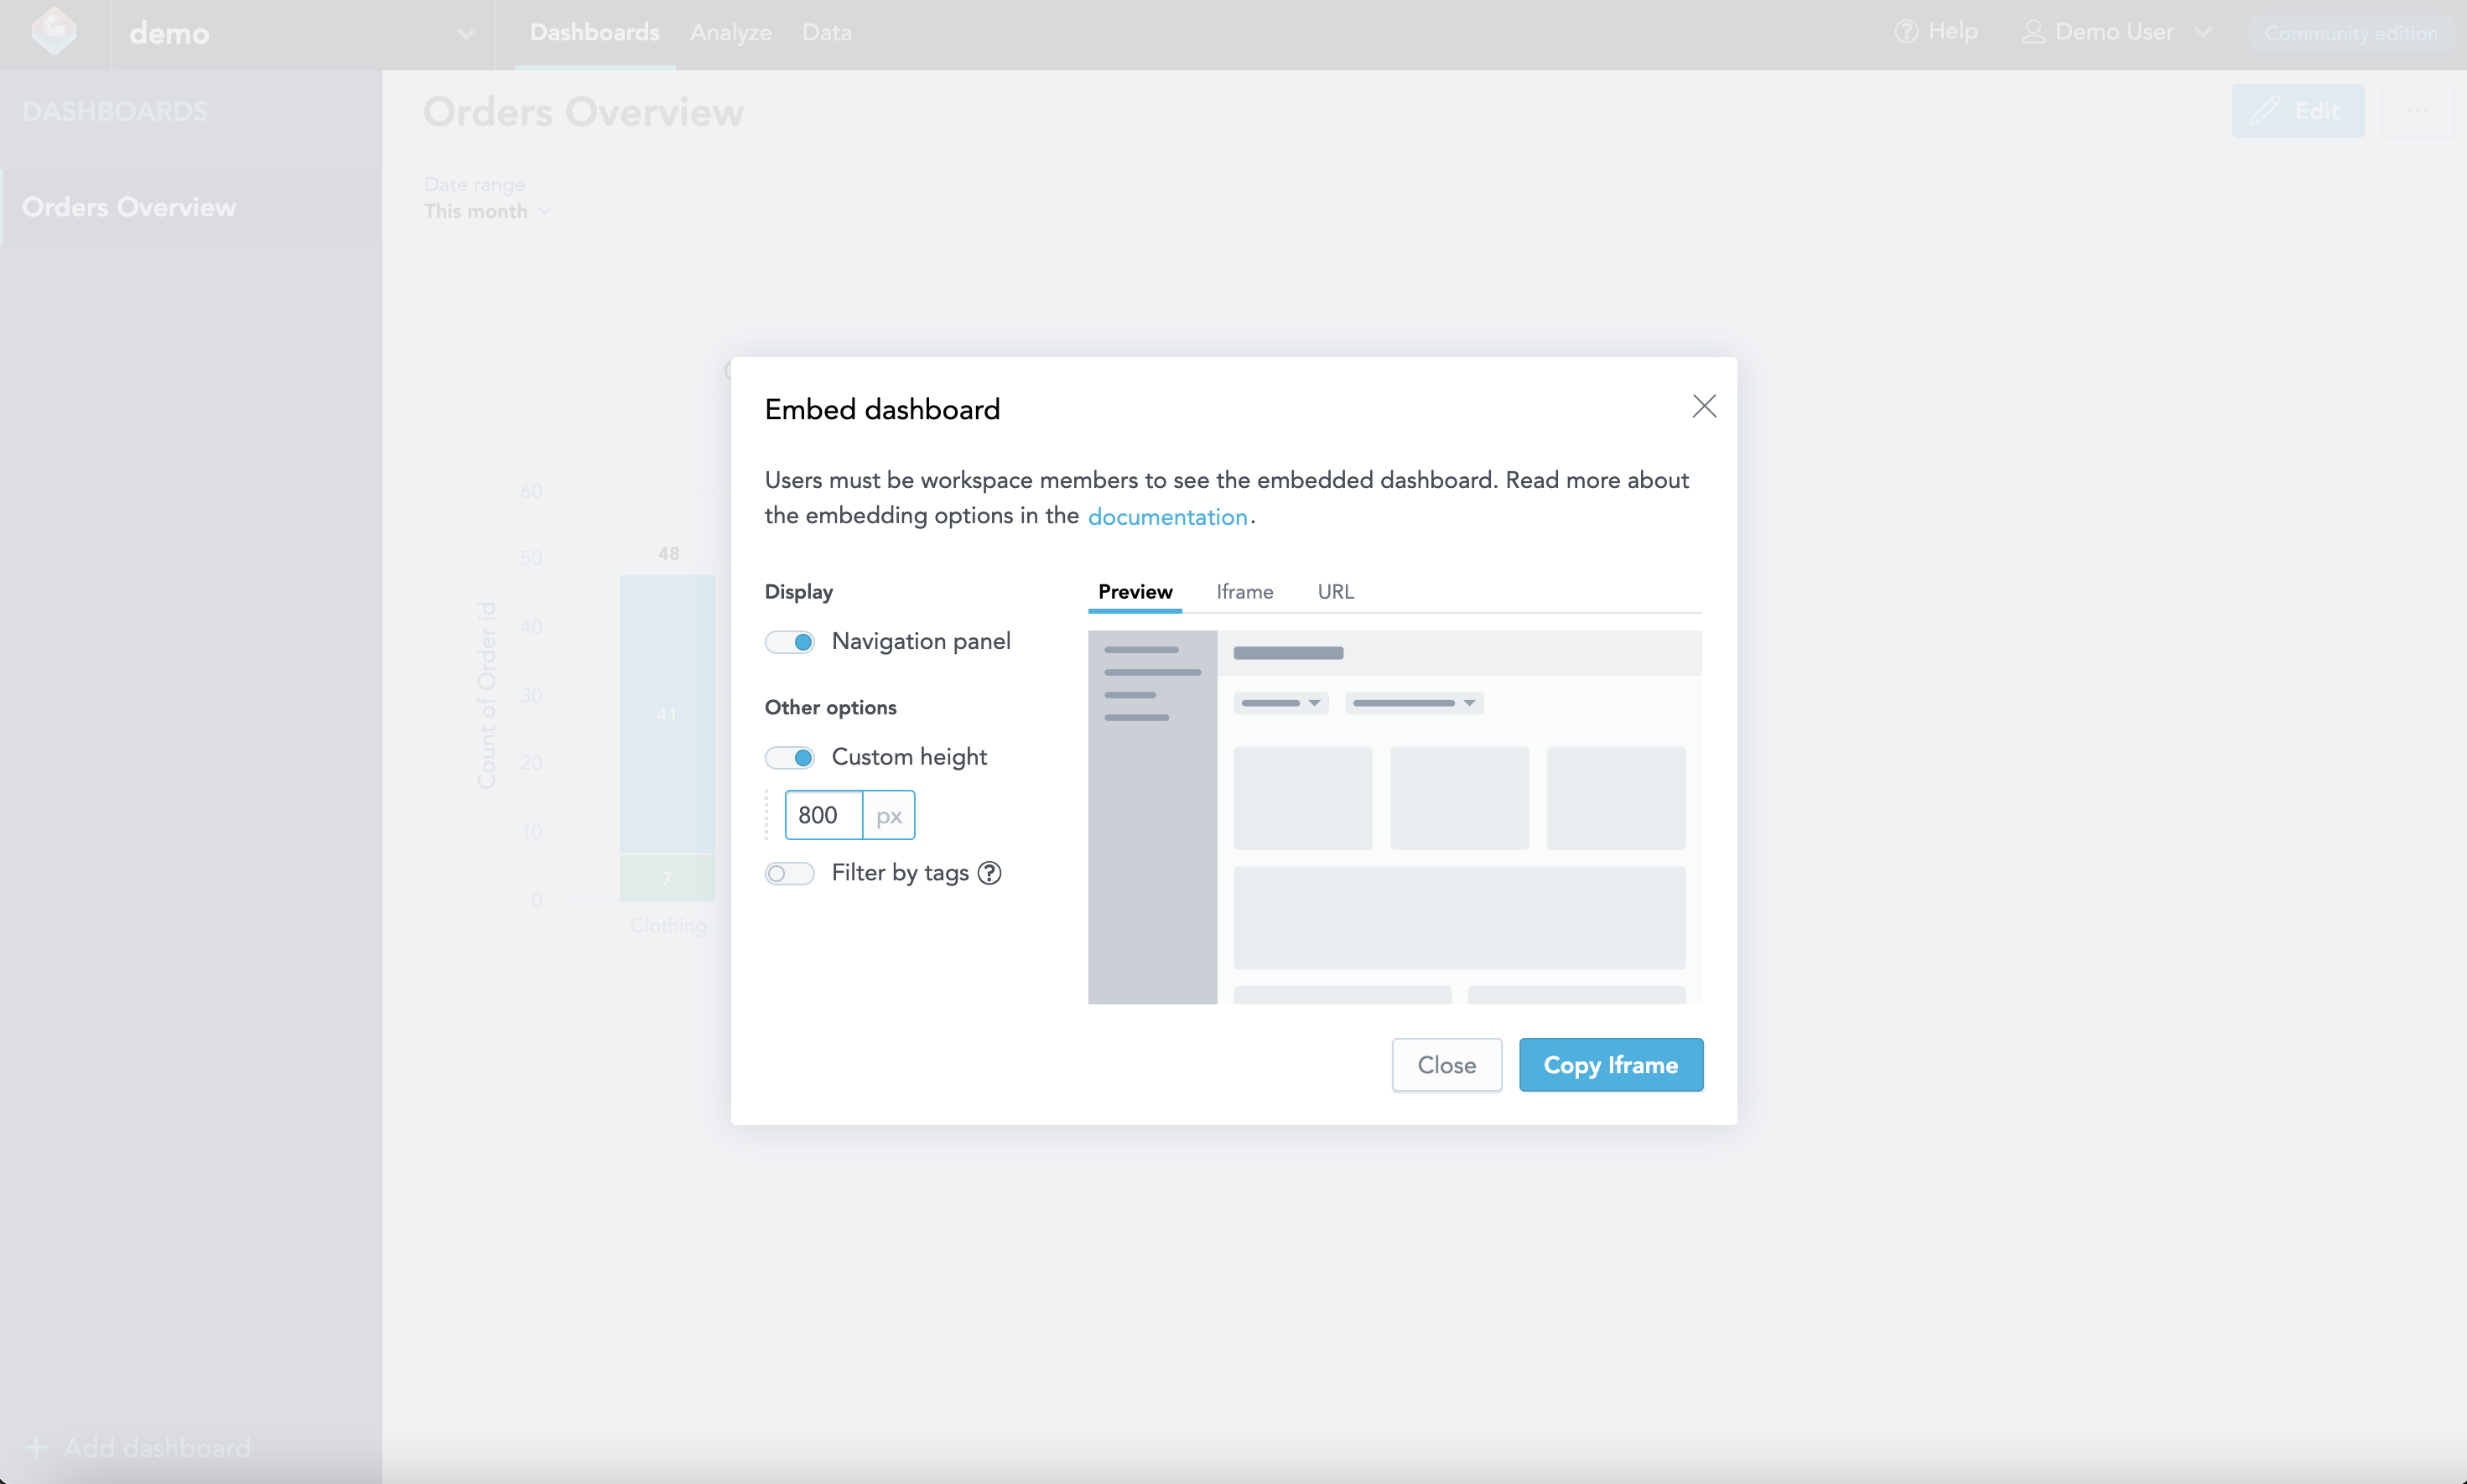
Configure the embedding options as needed.
Click Copy Iframe to copy the dashboard URL to the clipboard.
You can now use it to embed the dashboard into your web application.
Review More Examples
To see examples of using GoodData.UI components, visit the Example Gallery.