Bullet Charts
Bullet charts display performance of selected measures and progress towards a goal specified by another measure.
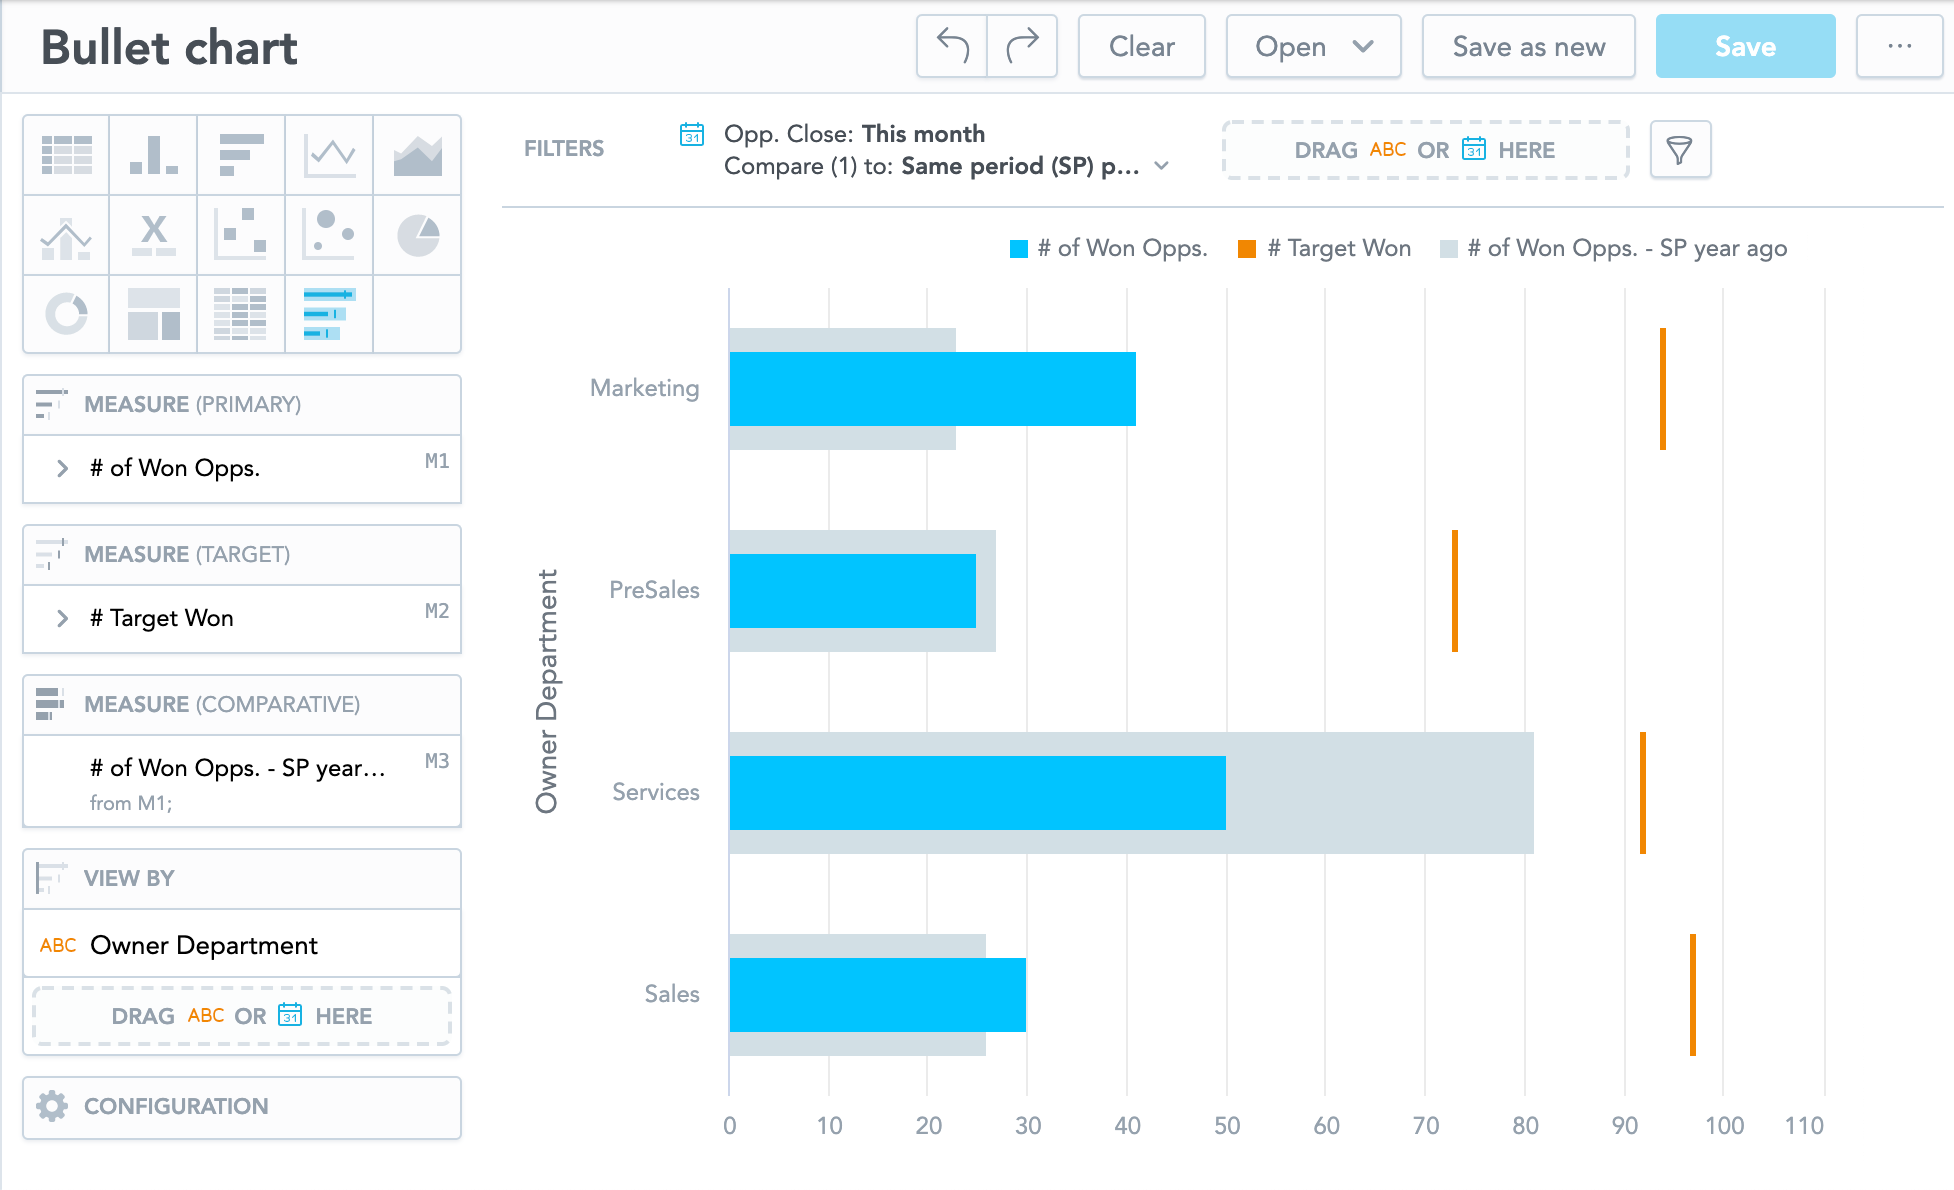
Bullet charts have the following sections:
- Measure (Primary)
- Measure (Target)
- Measure (Comparative)
- View by
- Configuration
In bullet charts, you can also compare your data to the previous period or the same period of the previous year. For details, see Time over Time Comparison.