Heatmaps
Heatmaps display data as a matrix where individual values are represented as colors. You can use heatmaps to discover trends and understand complex datasets.
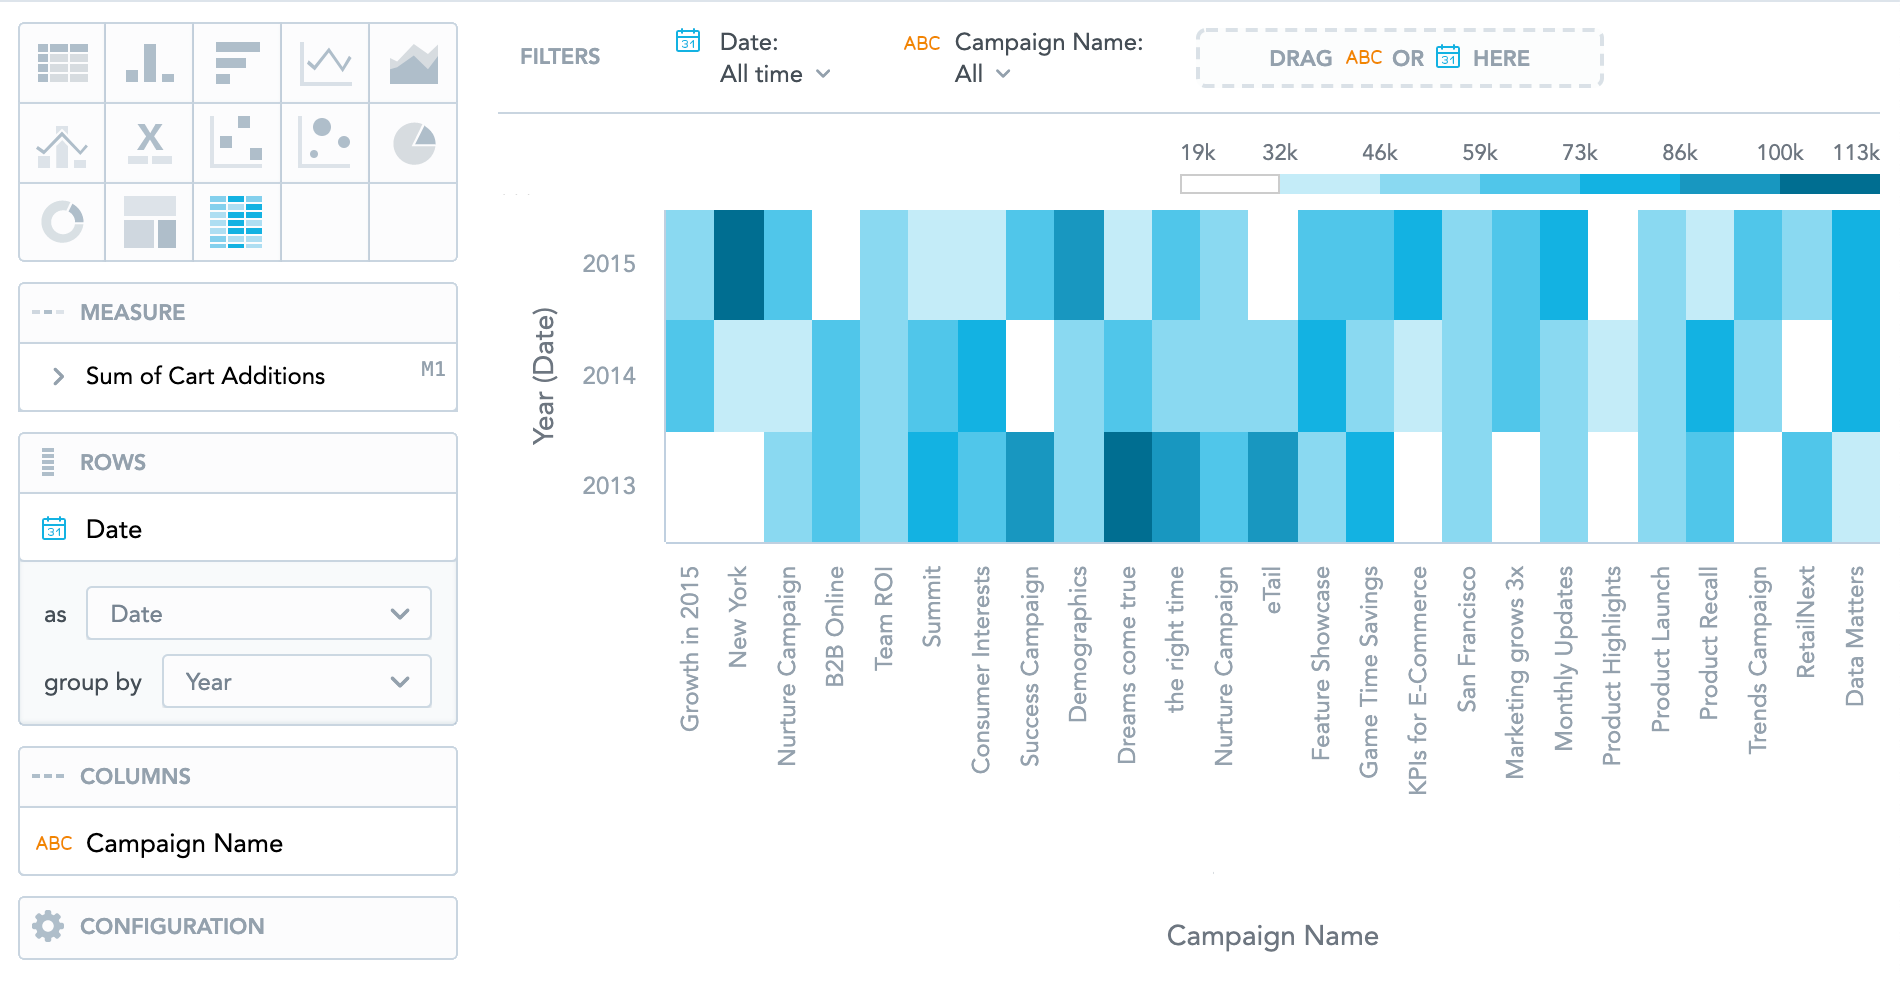
Heatmaps have the following sections:
- Measure
- Rows
- Columns
- Configuration
The legend above the heatmap shows the values of individual colors. The higher the value is, the darker the color is.
Clicking a value in the legend does not hide it from the insight.
For information about common characteristics and settings of all insights, see Insight Types.