Filter Insights by Metric Values
You can filter your data by values of the metrics used in your insight. For example, you can display data that corresponds to a specific metric value, falls within or outside of a certain interval, or is greater than the specified value.
The filter by metric value is available in all insights with at least one attribute or date (in other than the Metrics section) except for headlines. The value is applied after the date and attribute filters.
You can use any local metric (that is, any metric already in your insight) to filter by its values.
Add a Metric Value Filter to an Insight
Steps:
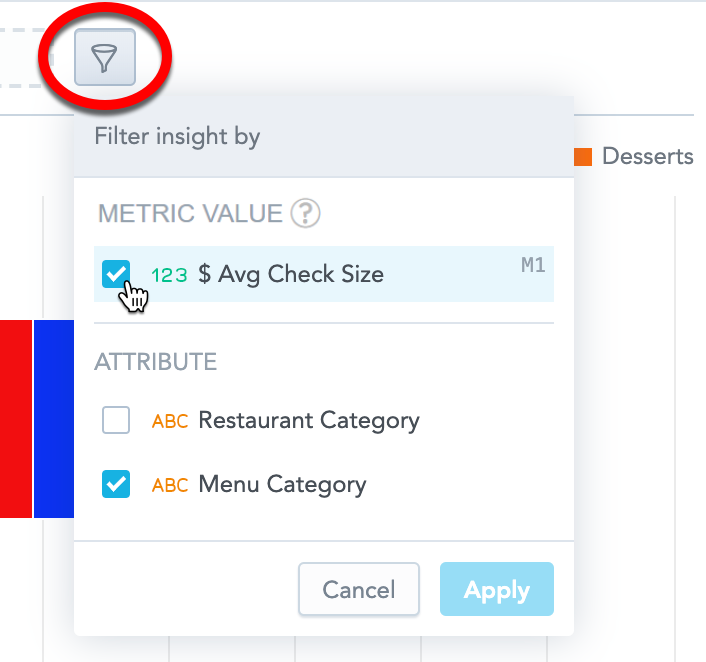
In the insight that you want to filter, click the filter bar dropdown icon.
In the Metric value section, select the metric that you want to use for filtering, and click Apply.
Analytical Designer adds the metric to the filter bar.
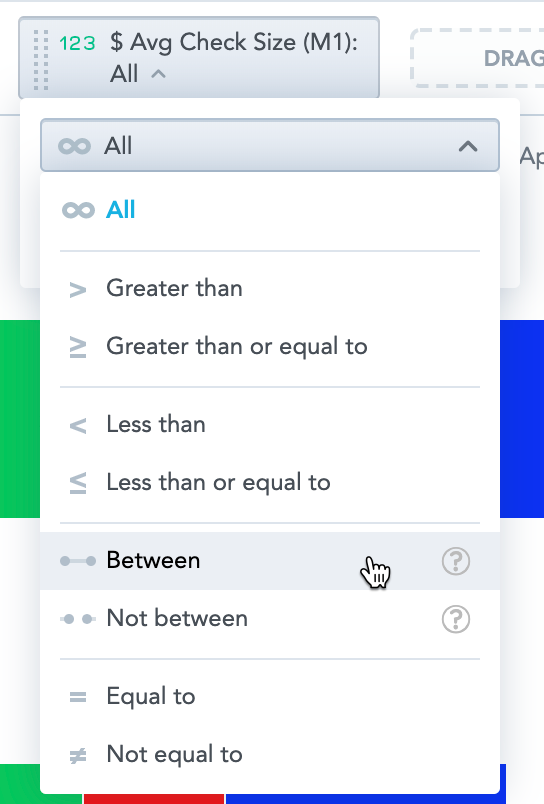
Click the metric in the filter bar and select one of the logical operators.
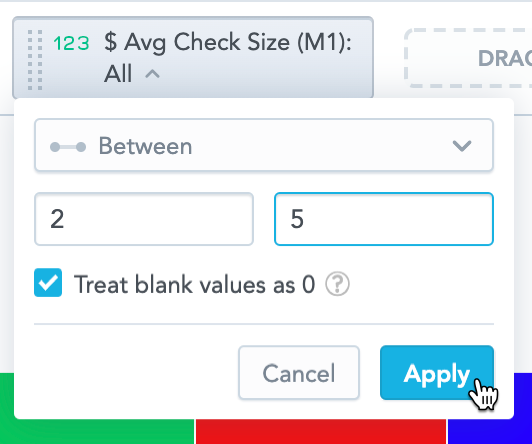
Specify the values for filtering, and click Apply.
If your insight displays data as percentages (the options Stack to 100% or Show in %), you must use the original values when specifying the filter, not the percentages.
Analytical Designer now filters your data according to your configuration.
- When you remove a metric used to filter the insight, Analytical Designer removes the filter as well.
- If you remove all attributes and dates from your insight, the filter by metric value is removed.
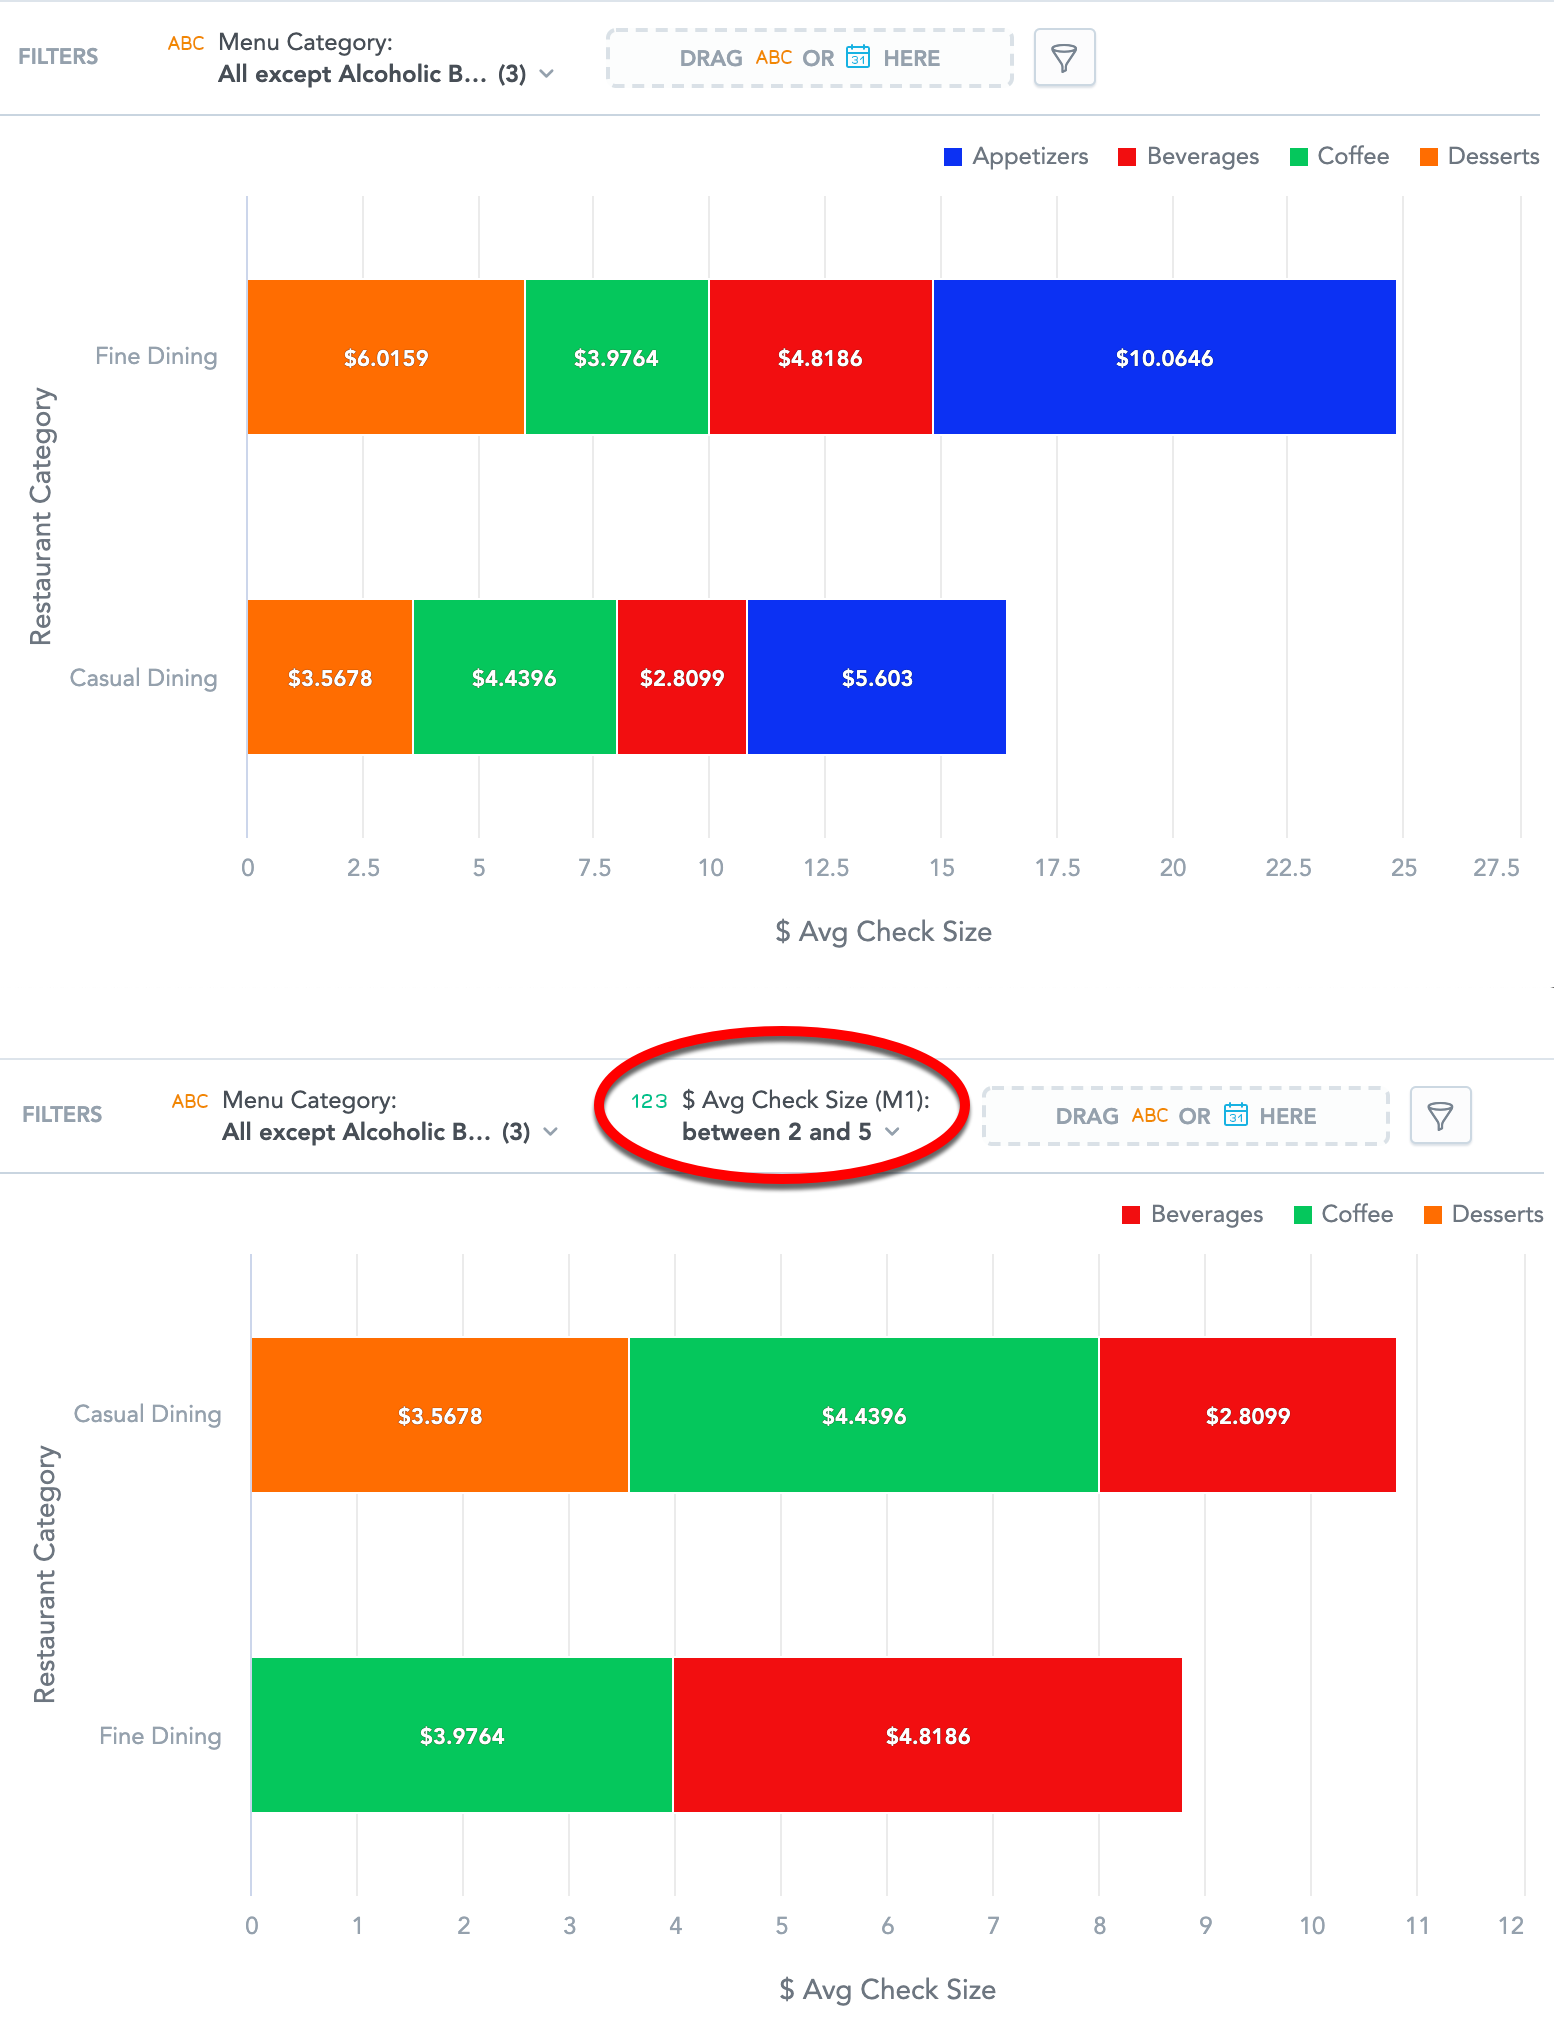
The following image shows an insight before and after the filtering specified above is applied.
Filter Null Values
A null value (null) means that there is no data available. Null values are displayed as dashes (-). Null values are not the same as zero values (0).
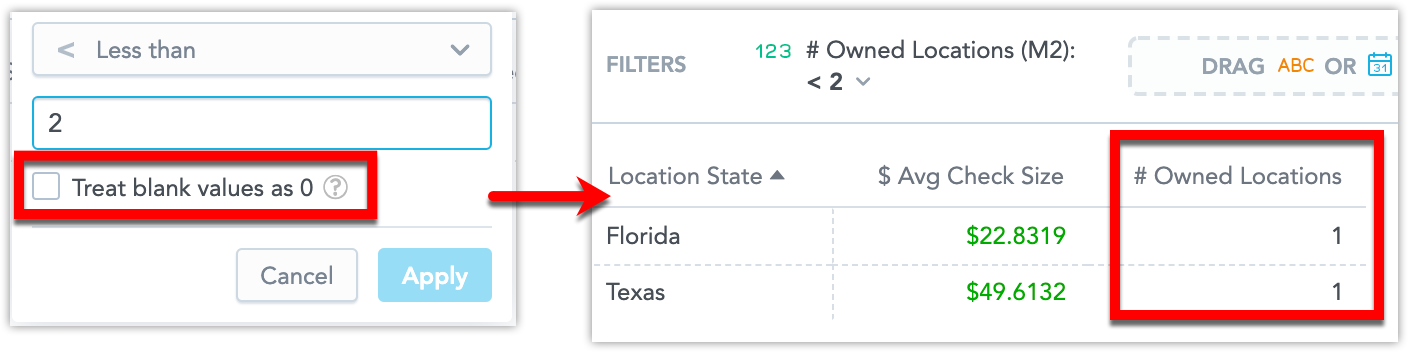
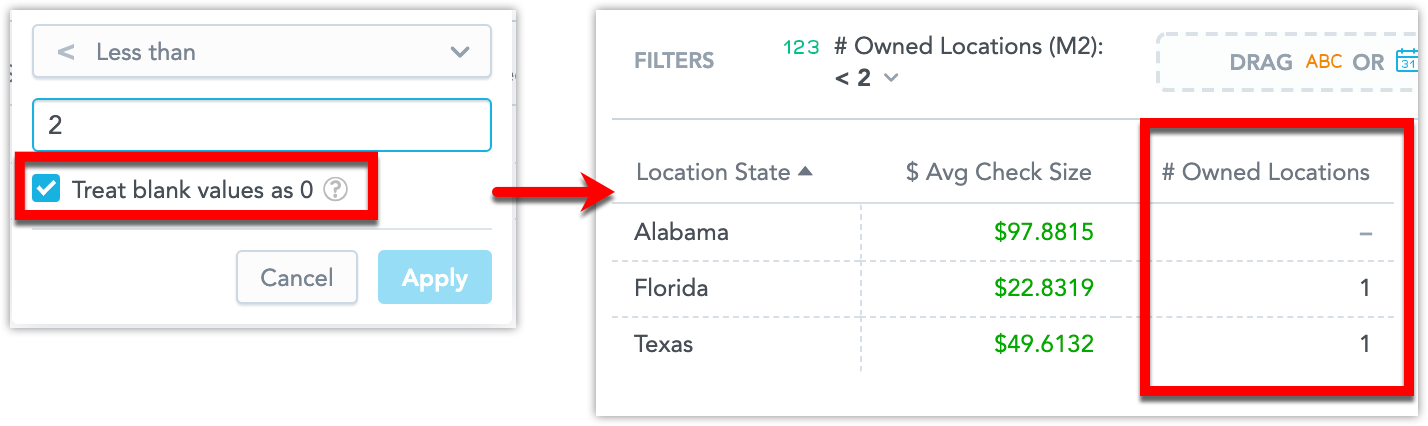
When you filter your data and the target values include null values, you can decide whether such values should be included in the final filtered insight. To include the null values, select the Treat blank values as 0 checkbox.
For example, you have an insight that displays an average check size ($ Avg Check Size) and the number of owned locations (# Owned Locations) in different states. The insight is filtered to display only the states with fewer than two owned locations.
In this picture, the insight has a filter with the option Treat blank values as 0 selected and therefore it shows the states with no owned locations (null values are included).
In this picture, the insight has a filter with the option deselected and therefore shows only the states with at least one location owned.