FORECAST - Adding a Trend Line
FORECAST functions returns linear regression estimates for up to 10 future periods based on existing data. Second parameter is the number of periods; the default is 3.
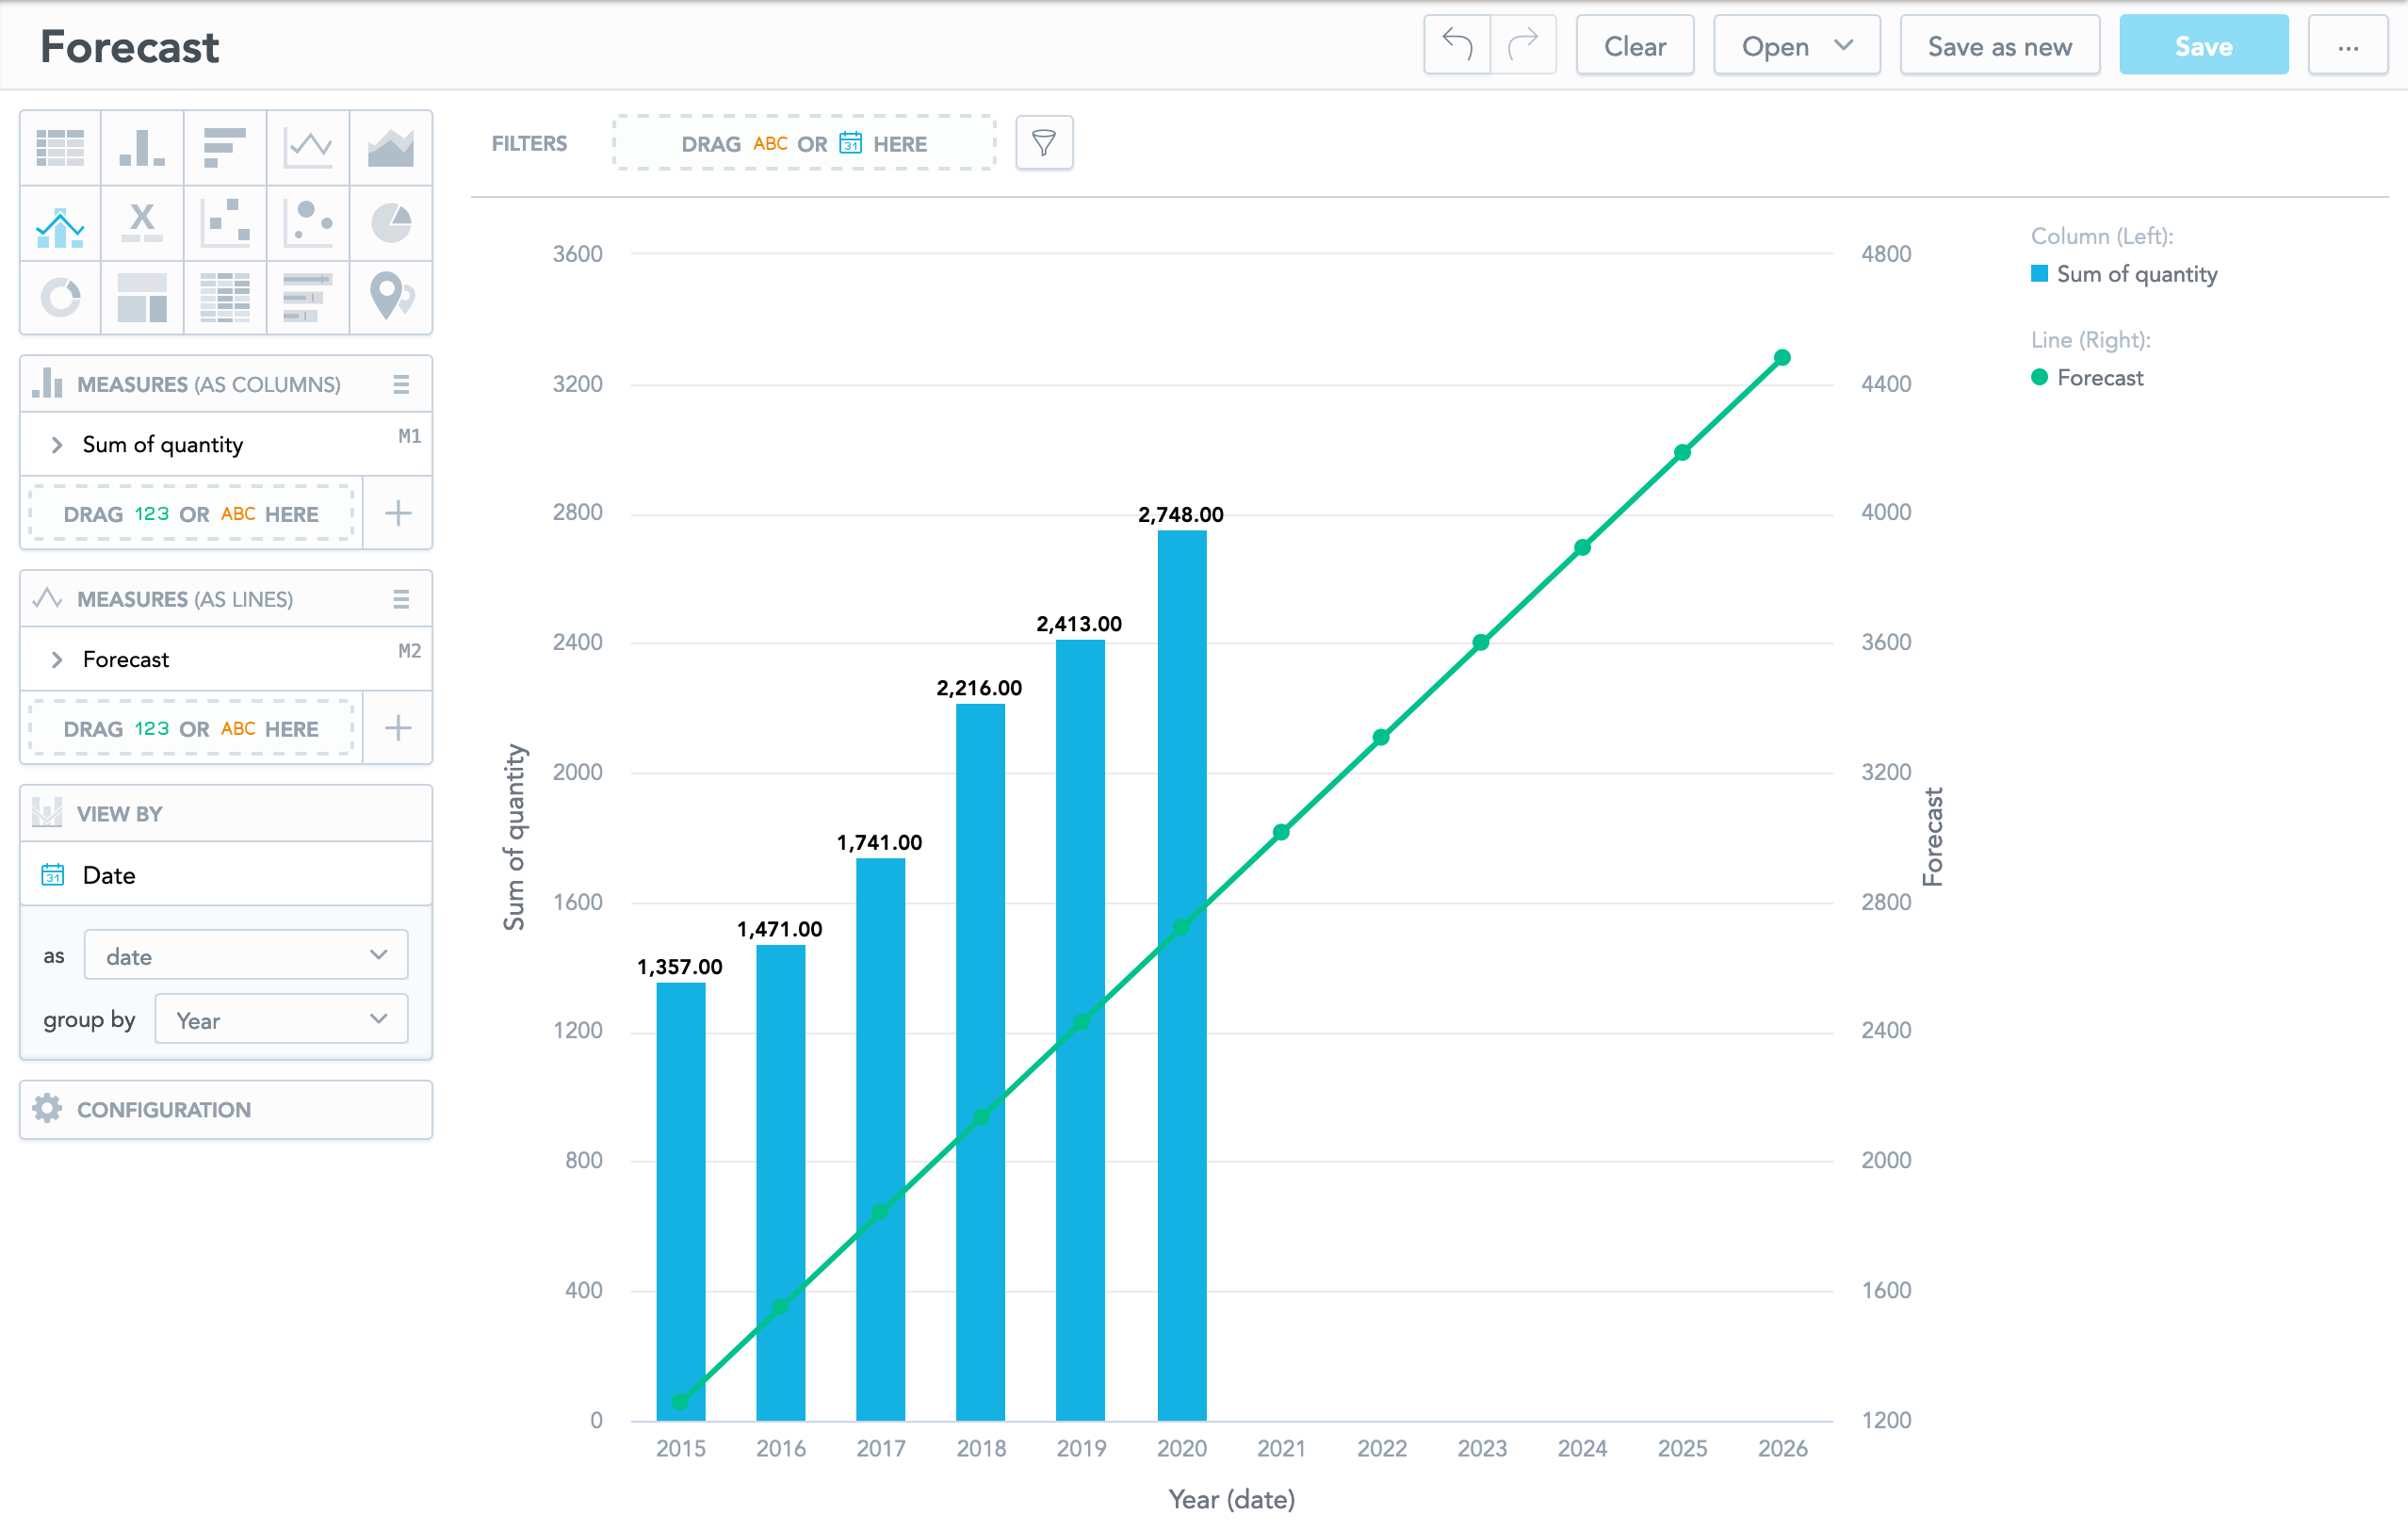
Use the FORECAST function to add a trend line to a visualization. A trend line uses linear regression to predict future periods based on the existing data. For example, you could use a trend line to predict future sales based on your historical data. Forecast visualizations must have one date/time attribute on the X axis, and no other attributes.
Syntax
SELECT FORECAST(... [, number of periods])
Optionally, you can specify a number of periods to forecast.
Format: number
Default: 3
All visualization filters are applied to the metric that you FORECAST except for date and time filters. To apply a date or time filter to the visualization, add it directly to the metric. For example:
SELECT FORECAST((SELECT COUNT({attribute/activity}) WHERE {label/date.year} = "2012"), 6)
Examples
SELECT FORECAST(SUM({fact/quantity}) , 6)
Suppose you create a forecast for the totals of Deal Size fact sliced
by the Month (Sale Closed) attribute. Use the following metric to
compute the next three months based on all historical data:
SELECT FORECAST(SUM({metric/deal_size}))
The following metric predicts Deal Size for the next six months:
SELECT FORECAST(SUM({metric/deal_size}), 6)
The following metric predicts Deal Size for the next two months using data from the previous year:
SELECT FORECAST((SELECT SUM({metric/deal_size}) WHERE {label/date.year} = PREVIOUS), 2)
The following metric predicts Deal Size for the next two months using data from the previous and current years:
SELECT FORECAST((SELECT SUM({metric/deal_size}) WHERE {label/date.year} = PREVIOUS OR {label/date.year} = THIS), 2)
The following metric predicts Deal Size for the next four months using data from the last twelve months:
SELECT FORECAST((SELECT SUM({metric/deal_size}) WHERE {label/date.month_year} >= THIS-12), 4)