Retrieve Data Through API
If you use Dashboards, Analytics Designer or GoodData.UI then these application get data from the GoodData platform for you. You are abstracted from low level AFM (Attributes, Filters, Metrics) API but if you want to get data from the GoodData Cloud or GoodData.CN, you need to utilize the AFM API.
The simple scenario to retrieve data is to use the following two endpoints:
- execute endpoint - executes analytical request and returns link to the result.
- result endpoint - returns response with computed data.
Retrieve Data by API
To retrieve data, you need to call the aforementioned two endpoints. The execute endpoint computes result based on AFM body. The result endpoint returns data based on resultId.
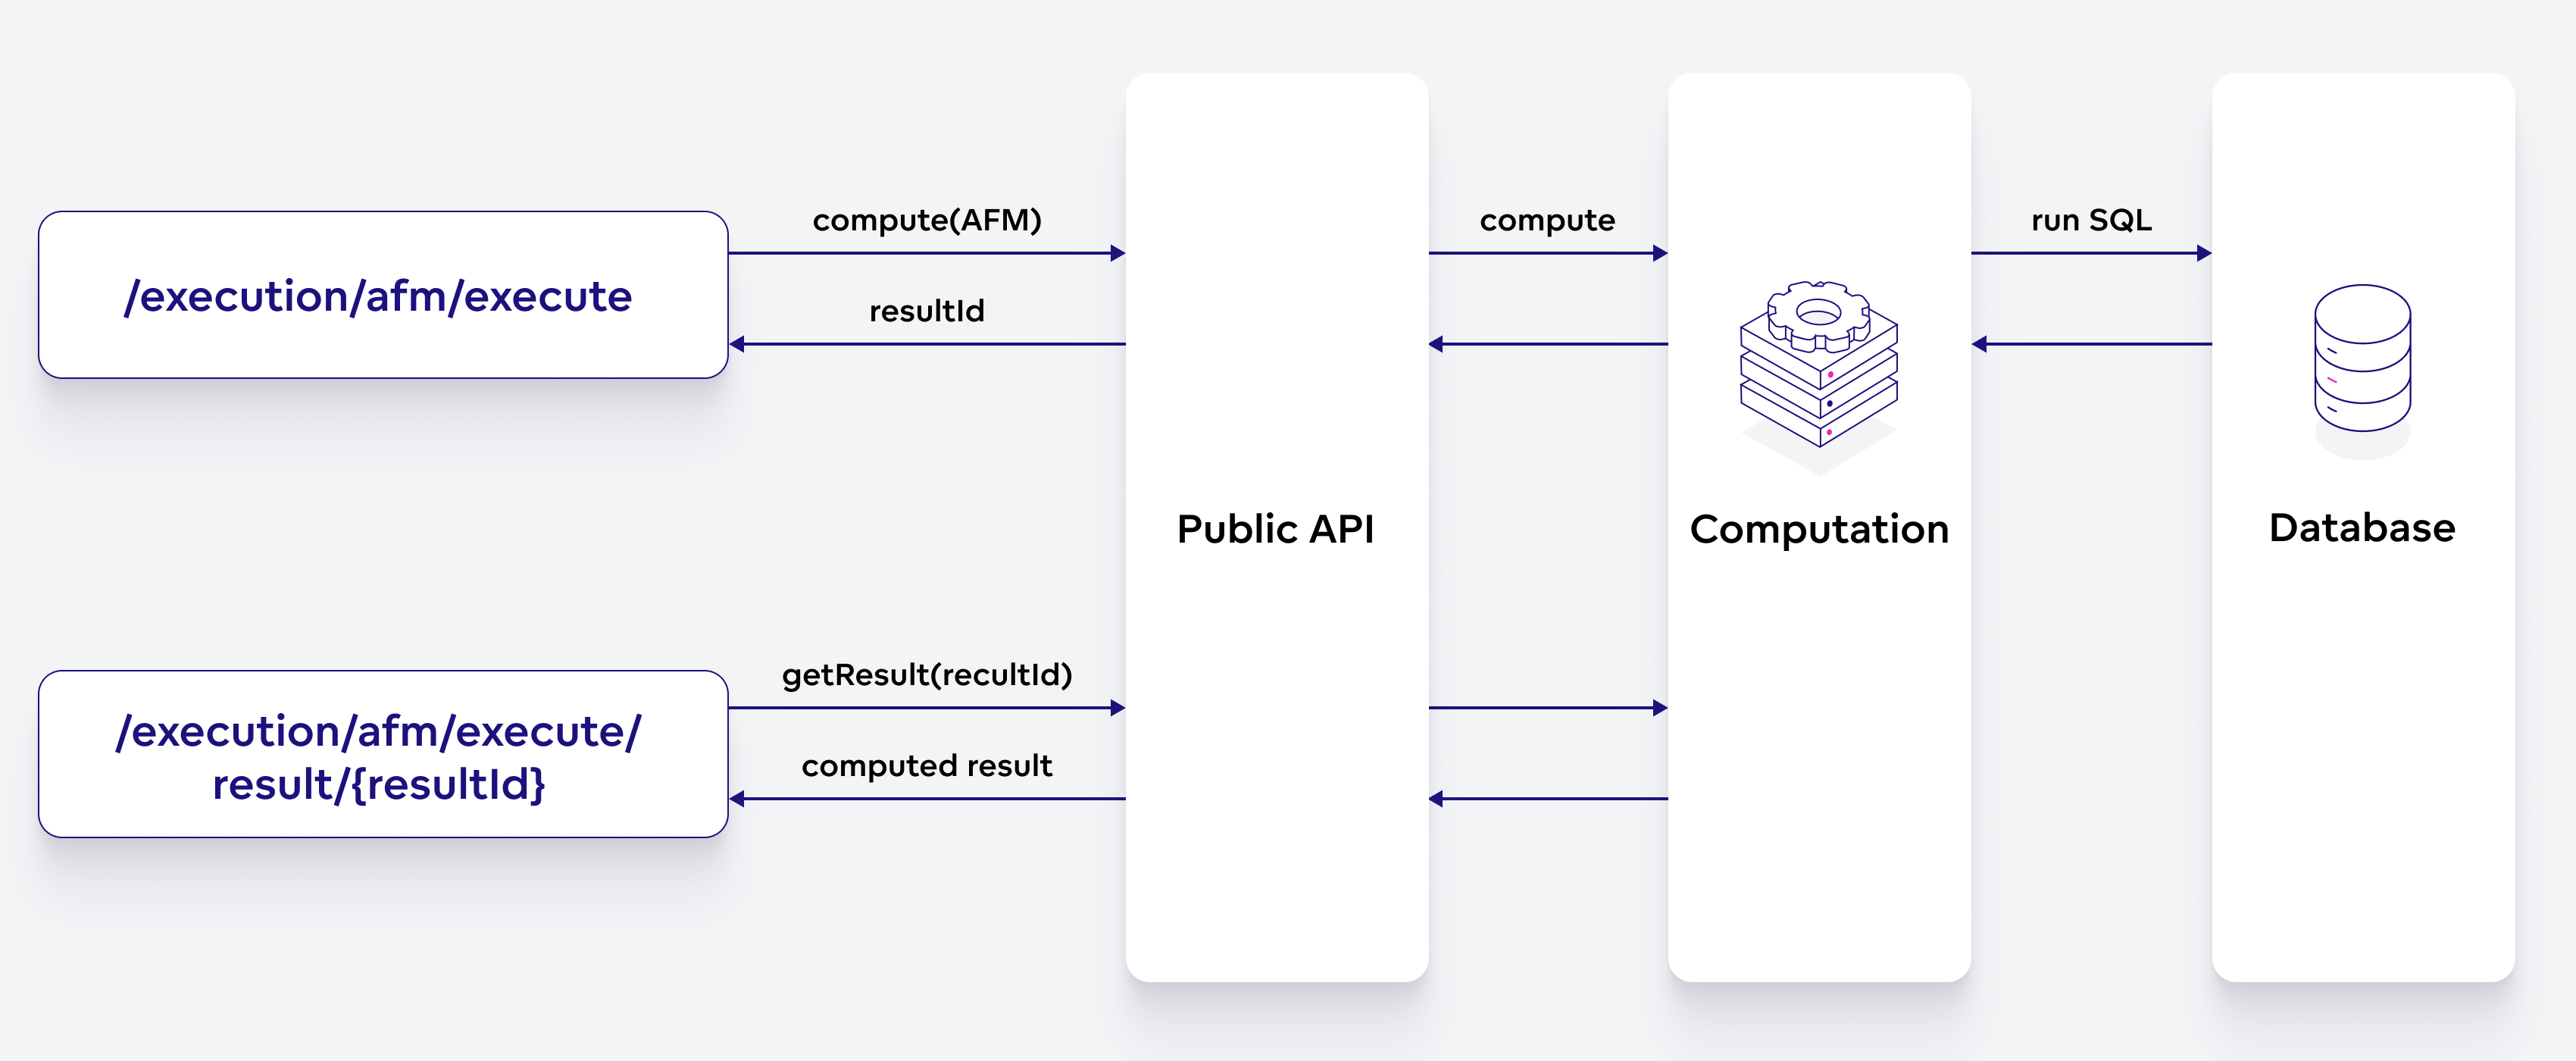
Please take into account that the diagram is simplified. In the computation engine, other processes happen in addition to what is shown on the diagram.
Understand the Concept
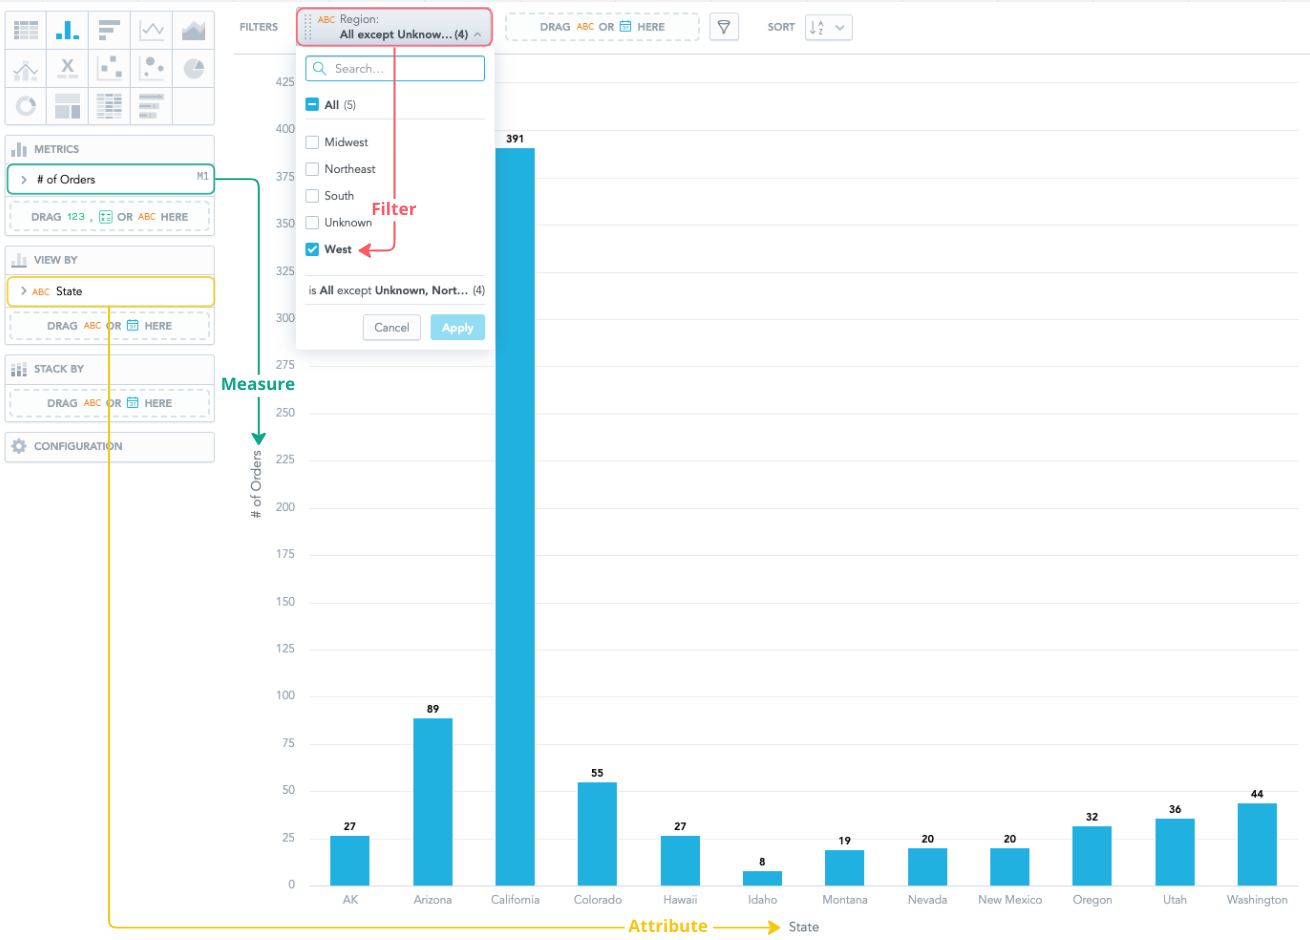
The key concept is the AFM (Attributes, Filters, Metrics):
- An attribute breaks the metric apart and provides context to the data.
- A filter is a set of conditions that removes specific values from your original data.
- A metric is a computational expression that aggregates one or more numerical values.
These are best described with an example. Imagine you are an account manager for an e-commerce shop. You want to know the number of orders in states that are in the west region. Let’s display your data as a column chart:
Compute
To compute the result, you need to call execute endpoint with the following body; in the body, you specify which attributes, filters, and metrics have to be used in the computation:
{
  "resultSpec":{
    "dimensions":[
      {
        "localIdentifier":"dim_0",
        "itemIdentifiers":["measureGroup"]
      },
      {
        "localIdentifier":"dim_1",
        "itemIdentifiers":["a_state"],
        "sorting":[
          {
            "attribute":{
              "attributeIdentifier":"a_state",
              "sortType":"DEFAULT"
            }
          }
        ]
      }
    ],
    "totals":[]
  },
  "execution":{
    "measures":[
      {
        "localIdentifier":"m_quantity_sum",
        "definition":{
          "measure":{
            "item":{
              "identifier":{
                "id":"quantity",
                "type":"fact"
              }
            },
            "aggregation":"SUM"
          }
        }
      }
    ],
    "attributes":[
      {
        "label":{
          "identifier":{
            "id":"state",
            "type":"label"
          }
        },
        "localIdentifier":"a_state"
      }
    ],
    "filters":[
      {
        "negativeAttributeFilter":{
          "label":{
            "identifier":{
              "id":"region",
              "type":"label"
            }
          },
          "notIn":{
            "values":[
              "Unknown",
              "Northeast",
              "Midwest",
              "South"
            ]
          }
        }
      }
    ],
    "auxMeasures":[]
  },
  "settings":{}
}
dimensions- communicate to the backend how to organize data. You can see in the body, we set that all metrics will be in the first dimensionsdim_0bymeasureGroup. In the second dimensiondim_1will be attributea_state.
Get Result
Once you get response from the execute endpoint, you will be given a resultId:
{
   "executionResponse":{
      "dimensions":[...],
      "links":{
         "executionResult":"<resultId>"
      }
   }
}
Now you can call result endpoint with the resultId to retrieve computed data:
{
   "data":[
      [27.0, 89.0, 391.0, 55.0, 27.0, 8.0, 19.0, 20.0, 20.0, 32.0, 36.0, 44.0]
   ],
   "dimensionHeaders":[
      {
         "headerGroups":[
            {
               "headers":[
                  {
                     "measureHeader":{
                        "measureIndex":0
                     }
                  }
               ]
            }
         ]
      },
      {
         "headerGroups":[
            {
               "headers":[
                  {
                     "attributeHeader":{
                        "labelValue":"AK",
                        "primaryLabelValue":"AK"
                     }
                  },
                  {
                     "attributeHeader":{
                        "labelValue":"Arizona",
                        "primaryLabelValue":"Arizona"
                     }
                  },
                  {
                     "attributeHeader":{
                        "labelValue":"California",
                        "primaryLabelValue":"California"
                     }
                  },
                  {
                     "attributeHeader":{
                        "labelValue":"Colorado",
                        "primaryLabelValue":"Colorado"
                     }
                  },
                  {
                     "attributeHeader":{
                        "labelValue":"Hawaii",
                        "primaryLabelValue":"Hawaii"
                     }
                  },
                  {
                     "attributeHeader":{
                        "labelValue":"Idaho",
                        "primaryLabelValue":"Idaho"
                     }
                  },
                  {
                     "attributeHeader":{
                        "labelValue":"Montana",
                        "primaryLabelValue":"Montana"
                     }
                  },
                  {
                     "attributeHeader":{
                        "labelValue":"Nevada",
                        "primaryLabelValue":"Nevada"
                     }
                  },
                  {
                     "attributeHeader":{
                        "labelValue":"New Mexico",
                        "primaryLabelValue":"New Mexico"
                     }
                  },
                  {
                     "attributeHeader":{
                        "labelValue":"Oregon",
                        "primaryLabelValue":"Oregon"
                     }
                  },
                  {
                     "attributeHeader":{
                        "labelValue":"Utah",
                        "primaryLabelValue":"Utah"
                     }
                  },
                  {
                     "attributeHeader":{
                        "labelValue":"Washington",
                        "primaryLabelValue":"Washington"
                     }
                  }
               ]
            }
         ]
      }
   ],
   "grandTotals":[],
   "paging":{
      "count":[1, 12],
      "offset":[0, 0],
      "total":[1, 12]
   }
}
data- the numerical points that you can display, for example, on the Y axis of a column chart.headers- the text-based points that you can display, for example, on the X axis of a column chart or in a legend.
Next steps
If you do want to fetch data from the GoodData, but you do not want to use API, you can use Python SDK, or GoodData.UI that provide you with a level of API abstraction.