Manage Visualizations on Dashboards
On dashboards, you can:
- Create and save new visualizations using Analytical Designer.
- Add visualizations created in Analytical Designer (see Create Visualizations).
- Set up date and attribute filters for the whole dashboard and all its viewers.
You can add as many dashboards to your workspace as you want.
However, we recommend that you review your dashboards periodically and keep only those that are relevant to your users.
Visualization Configuration
To display the visualization settings, click the visualization on a dashboard and select Configuration.
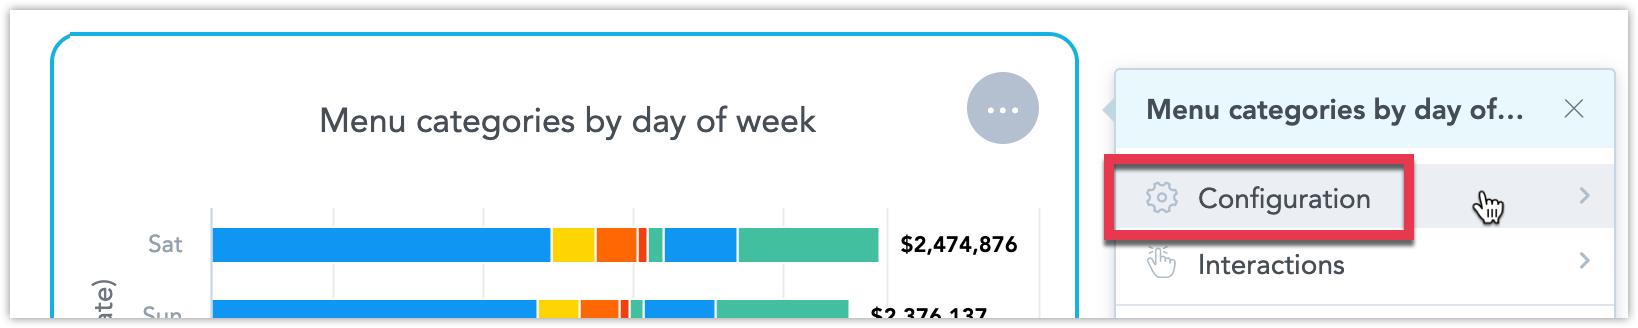
In the visualization configuration, you can:
- Hide the title of the visualization.
- Change the visualization description.
The description is displayed when you click on the question mark next to the visualization name.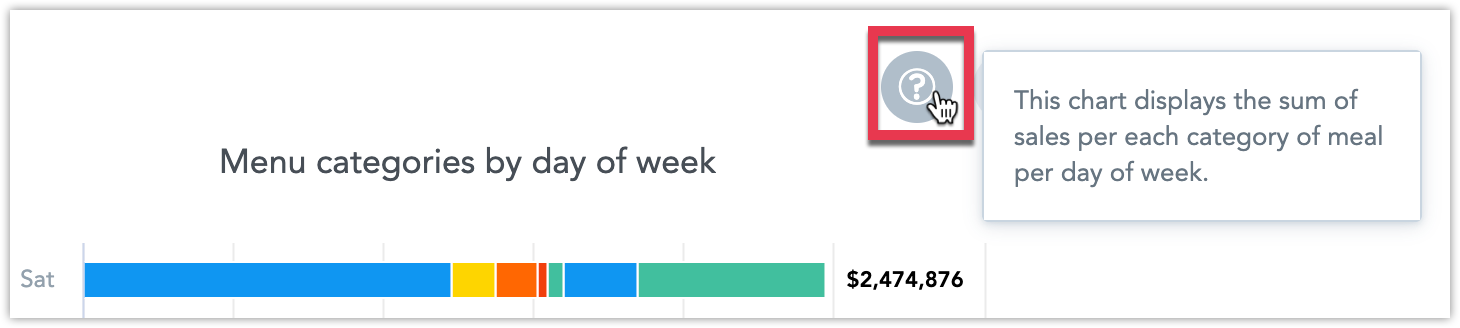
- By default, the description is inherited from Analytical Designer.
- You can also add a custom text or disable the description from displaying.
- Enable or disable dashboard date and attribute filters.
Any change to the configuration applies only to the one particular instance of this visualization.
Create a New Visualization on a Dashboard
Steps:
Drag and drop the Insight item to the dashboard area.
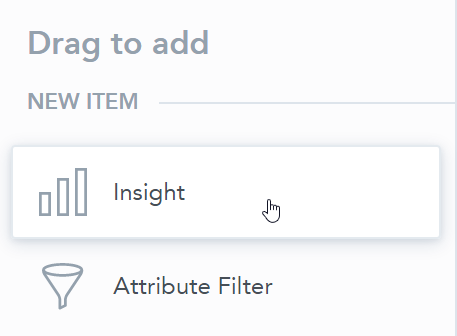
The Analytical Designer opens.
Build your visualization.
Click Save to automatically add the visualization to the dashboard.
For details about visualization configuration options, see Create Visualizations.
Add an Existing Visualization
To add an existing visualization, drag the visualization from the Saved visualizations list and drop it to the dashboard area.
We recommend that you keep the total number of visualizations on a single dashboard at 16 or less to avoid delays in computation.
Explore Visualizations
Dashboards allow you to display visualizations in Analytical Designer to explore their settings.
You can even edit the visualization and save it as a new one.
Steps:
On your dashboard, click the three dots icon in top right corner of the visualization.
Click Explore from here.
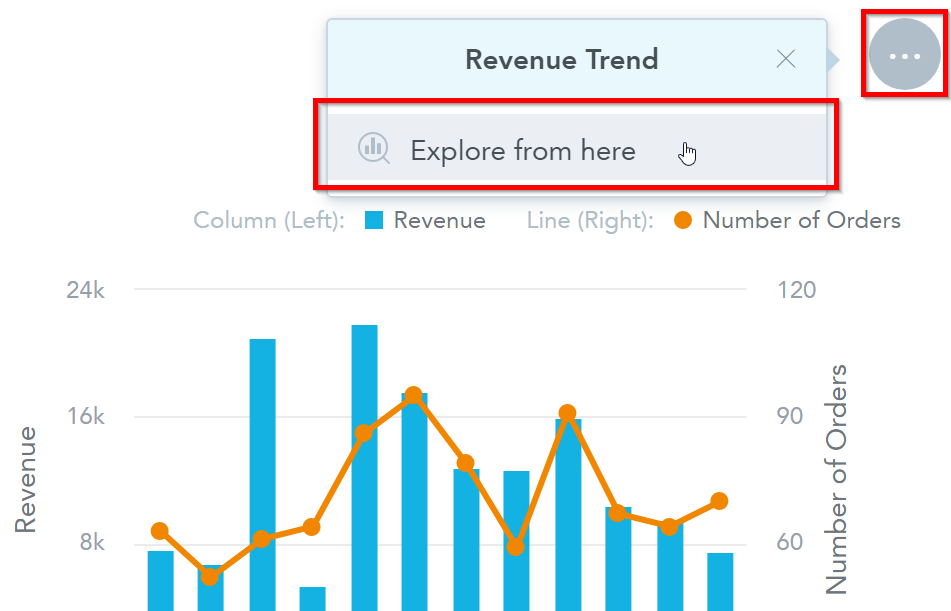
The visualization opens.
To return to dashboards, click Cancel.
You can edit the visualization and then click Save to create a new visualization.
This does not update the visualization on your dashboard. To add the newly created visualization to the dashboard, you must edit the dashboard.
Edit a Visualization
Dashboards allow you to edit visualizations in Analytical Designer and update them on your dashboards automatically.
Steps:
On your dashboard, click Edit to open the dashboard.
Click the three dots icon in top right corner of the visualization.
Click Edit.
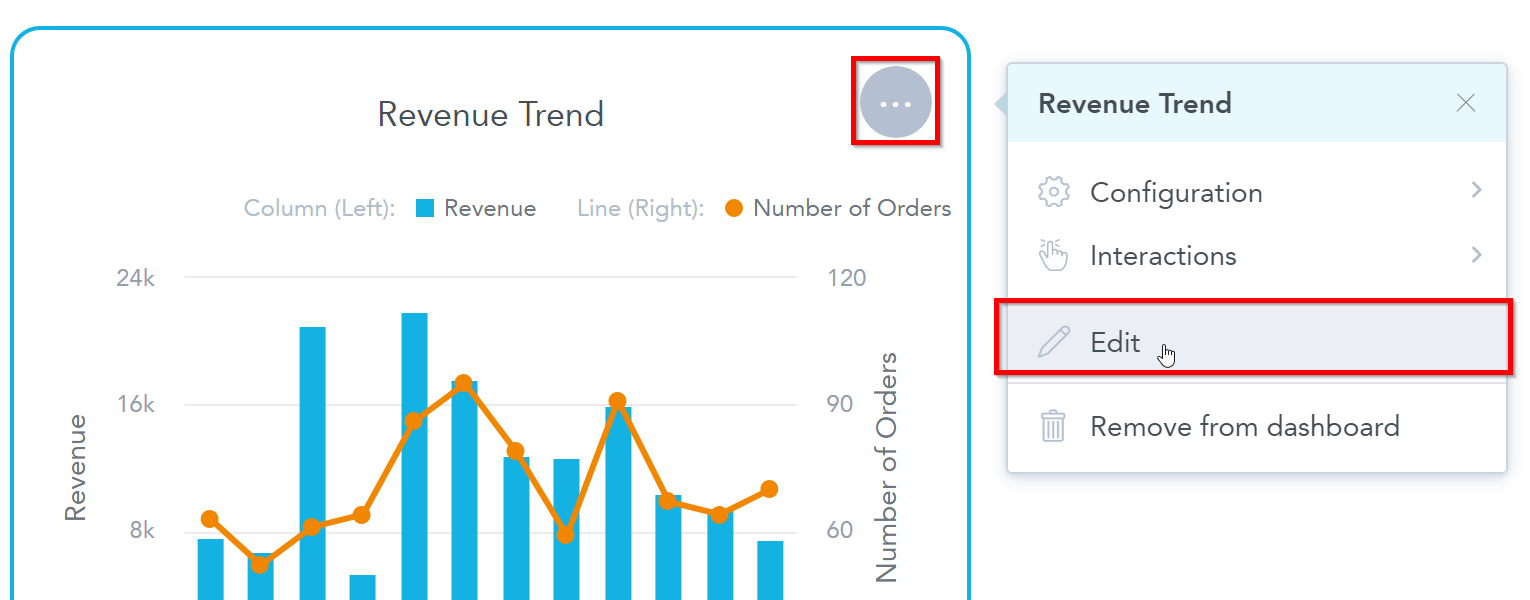
The visualization opens for editing.
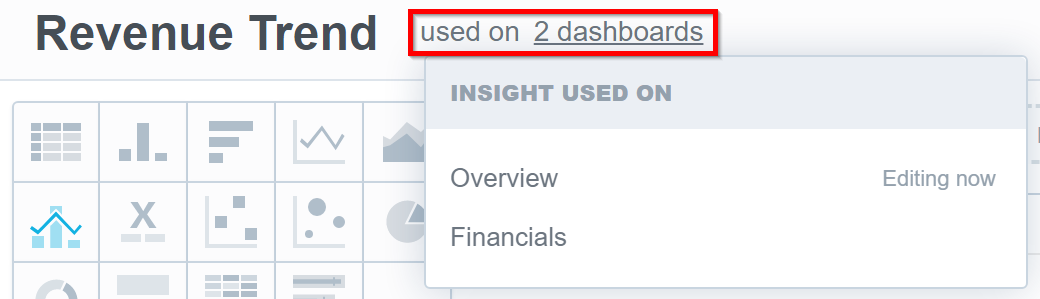
Modify the visualization. To see a list of dashboards that include this visualization, click the link to the right of the visualization name. Click the name of the dashboard to open it in a new window.
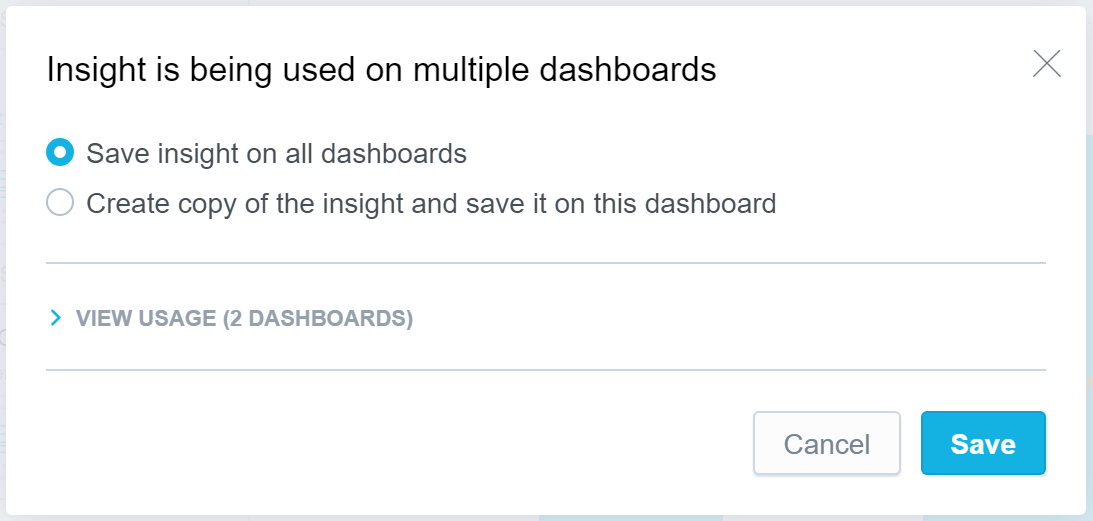
If the visualization is included on multiple dashboards and you want to update it on all dashboards, select Save visualization on all dashboards and click Save.
If the visualization is included on multiple dashboards and you want to update it only for the current dashboard, select Create copy of the visualization and save it on this dashboard, type a new name and click Create a copy.
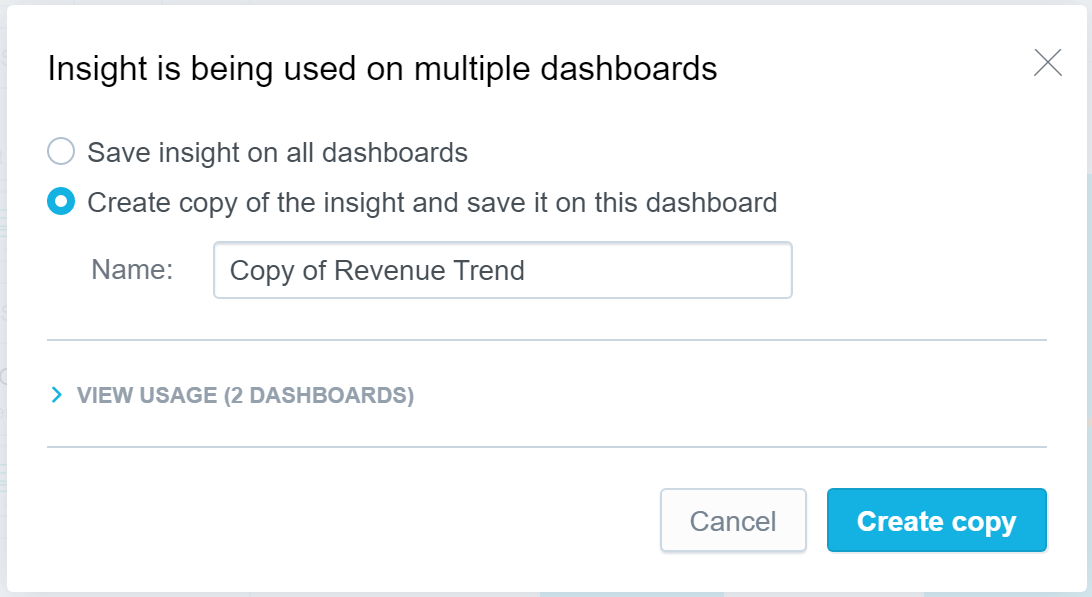
The dashboard exchanges the visualization for the new one.
Click Save.
Delete a Visualization
Steps:
On your dashboard, click Edit.
Click the three dots icon in top right corner of the visualization.
Click Remove from dashboard.
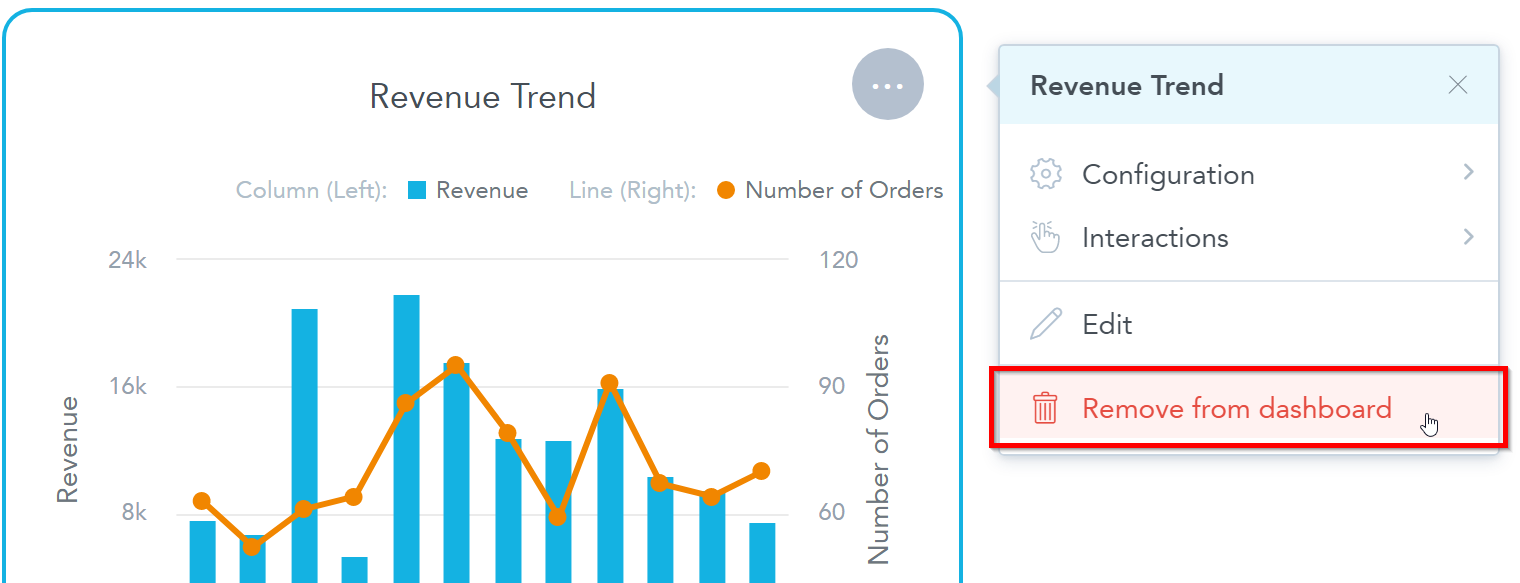
Save & Publish the dashboard.