Export Dashboards
In Dashboards, you can export the whole dashboard to PDF files, or individual visualizations as XLSX or CSV files.
Export Whole Dashboard
Disclaimer - Beta Feature
Support for PDF export is in beta. Beta features are available for users to test and provide feedback. They do not have their implementation finalized. The behavior or interface for these features may change in the future.
You can export the whole dashbaord through the user interface in Dashboards or via API.
- Open the dashboard that you want to export.
- Click the three dots icon in the top right corner.
- Click Export to PDF.
- Save the file. Dashboards save the file to your hard drive.

To export a dashboard, submit a POST request to /api/actions/workspaces/{workspace-id}/export/visual:
curl $HOST_URL/api/v1/actions/workspaces/$WORKSPACE_ID/export/visual \
  -H "Content-Type: application/vnd.gooddata.api+json" \
  -H "Accept: application/vnd.gooddata.api+json" \
  -H "Authorization: Bearer <API_TOKEN>" \
  -X POST \
  -d '{
      "fileName": "<export_filename>",
      "dashboardId": "<dashboard_id>"
  }' | jq .
The response body contains the export_id that you can use later to receive this export again.
To receive a previously generated export, submit a GET request to /api/actions/workspaces/{workspace-id}/export/visual/{export-id}:
curl $HOST_URL/api/v1/actions/workspaces/$WORKSPACE_ID/export/tabular/$EXPORT_ID \
  -H "Authorization: Bearer <API_TOKEN>" \
  -X GET \
  --output <export_filename>.pdf
For details about the exported file, see the File types section.
Export Individual Visualizations
- Open the dashboard from which you want to export visualizations.
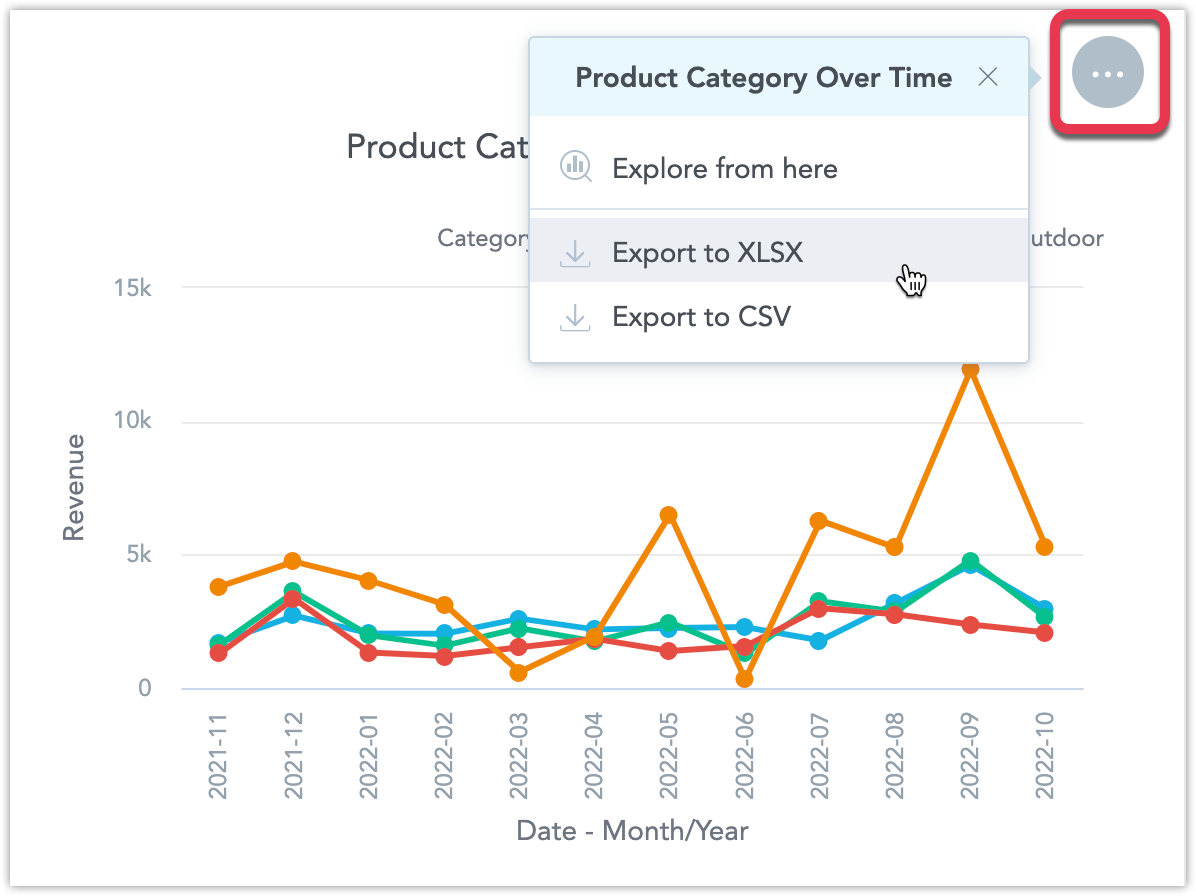
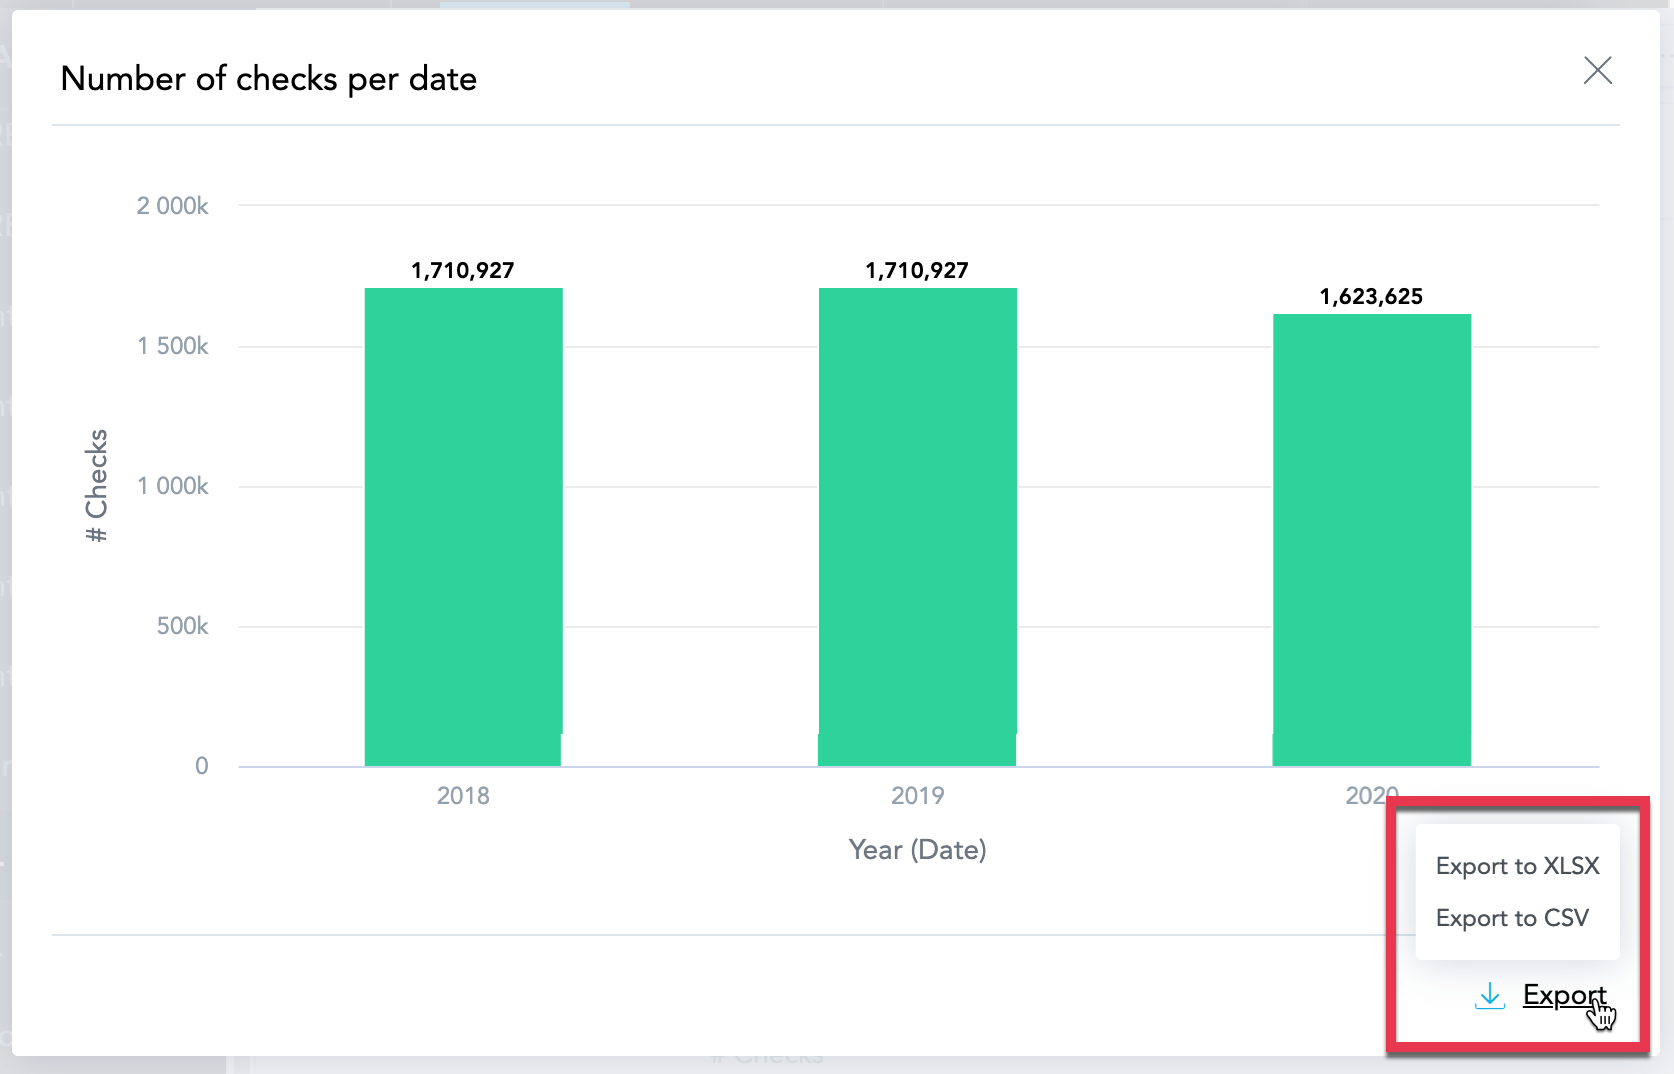
- Hover your mouse over the visualization that you want to export.
- Click the three dots in the top right corner.
- Click Export to CSV.
- Save the file.
For details about the exported file, see the File types section.
If you drill down or drill to an insight from a dashboard, you can also export this insight to XLSX or CSV.
File Types
GoodData.CN Community Edition does not support PDF exports.
The PDF file includes the dashboard name, date of the export, and page numbers.
XLSX
Headline visualizations cannot be exported as XLSX.
Export your data to an XLSX file if you want to analyze the formatted data in a spreadsheet.
XLSX with Unmerged Cells
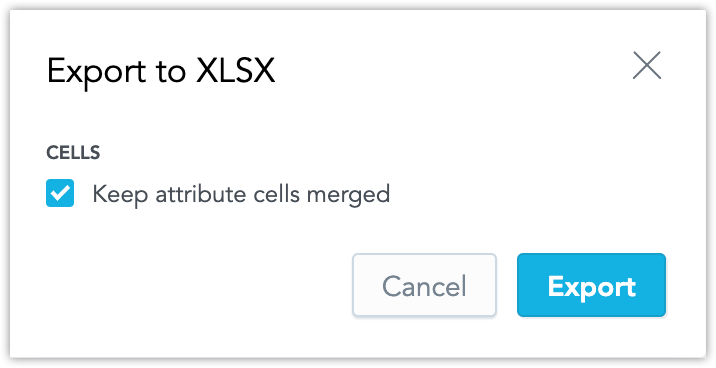
By default, visualizations that are grouped by attributes contain merged cells in the exported XLSX file.
To export without merging, unselect Keep attribute cells merged in the Export to XLSX dialog.
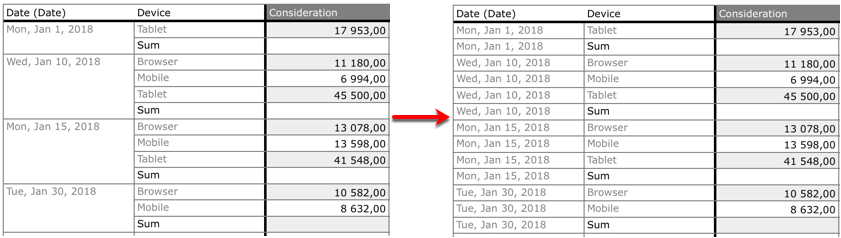
The following image shows the difference between exported data with merged and unmerged cells in the Date (Date) column.
Custom Number Format
By default, when you export visualizations to XLSX, the number formats applied to the cells containing metrics are propagated to the result XLSX file exactly as defined in the visualization.
For example, if some metrics in an visualization have a number format that displays negative numbers in red and positive numbers in green, this format will be applied to the cells with these metrics in the XLSX file.
Note
To pass into XLSX any custom format as is, it’s possible to use the [excel] command in the custom metric editor followed by the static Excel custom format. For example, #,##0.00[excel][red]#,##0.00;.
The command [excel] must always be the last command in the definition.
CSV
Headline visualizations cannot be exported as CSV.
If you want to process report data in more detail in another application, and do not need formatting, export the report as a CSV file.