Headline
Headlines can display a single number or compare two numbers. They are useful for highlighting the most important data. You can display both the metrics and the attributes.
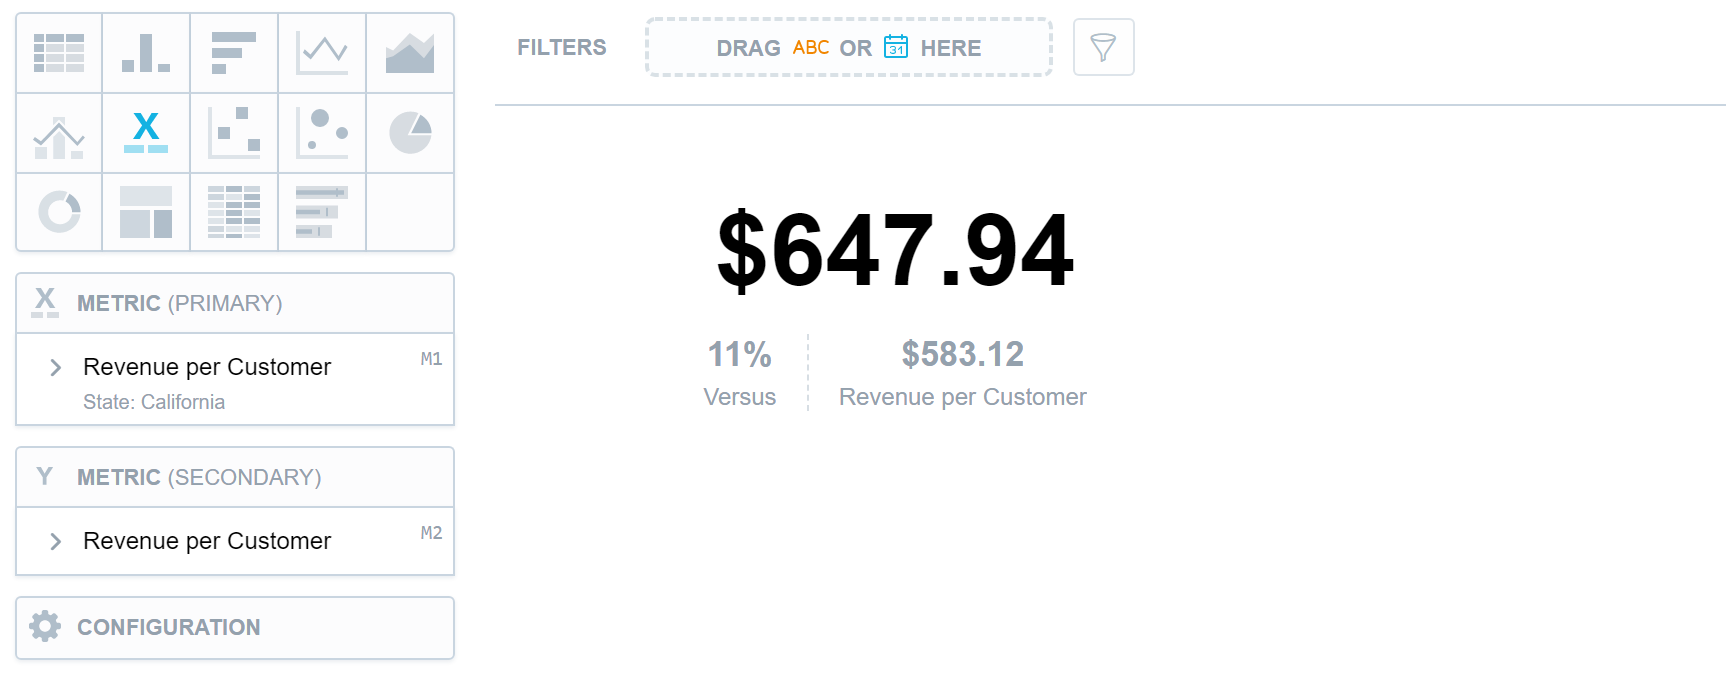
Headlines have the following sections:
- Metric (primary)
- Metric (secondary)
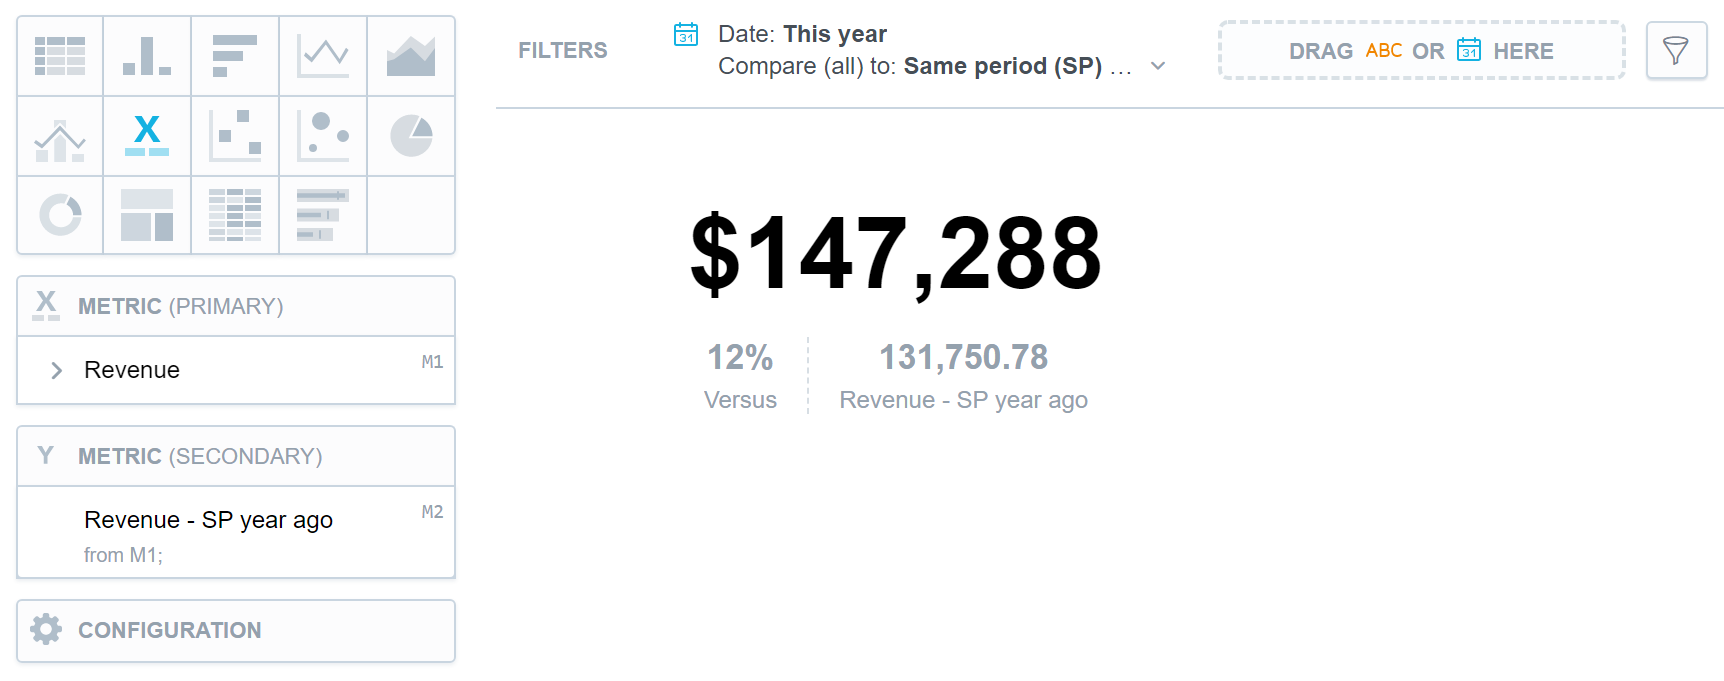
You can add one item to each section. If you add two items, the visualization also displays the change in percent (versus) between the primary metric (the main number) and the secondary metric.
To compare your data to the same period of the previous year, see the Time over Time Comparison section.
For information about common characteristics and settings of all visualizations, see the Visualization Types section.