Pyramid Chart
This visualization type is only available in GoodData Cloud.
Pyramid charts are great at showing hierarchical structures and the relative proportions of different values. Typically, they are used for displaying demographic data, market segmentation, or organizational structures.
This visualization type is not available in GoodData.CN.
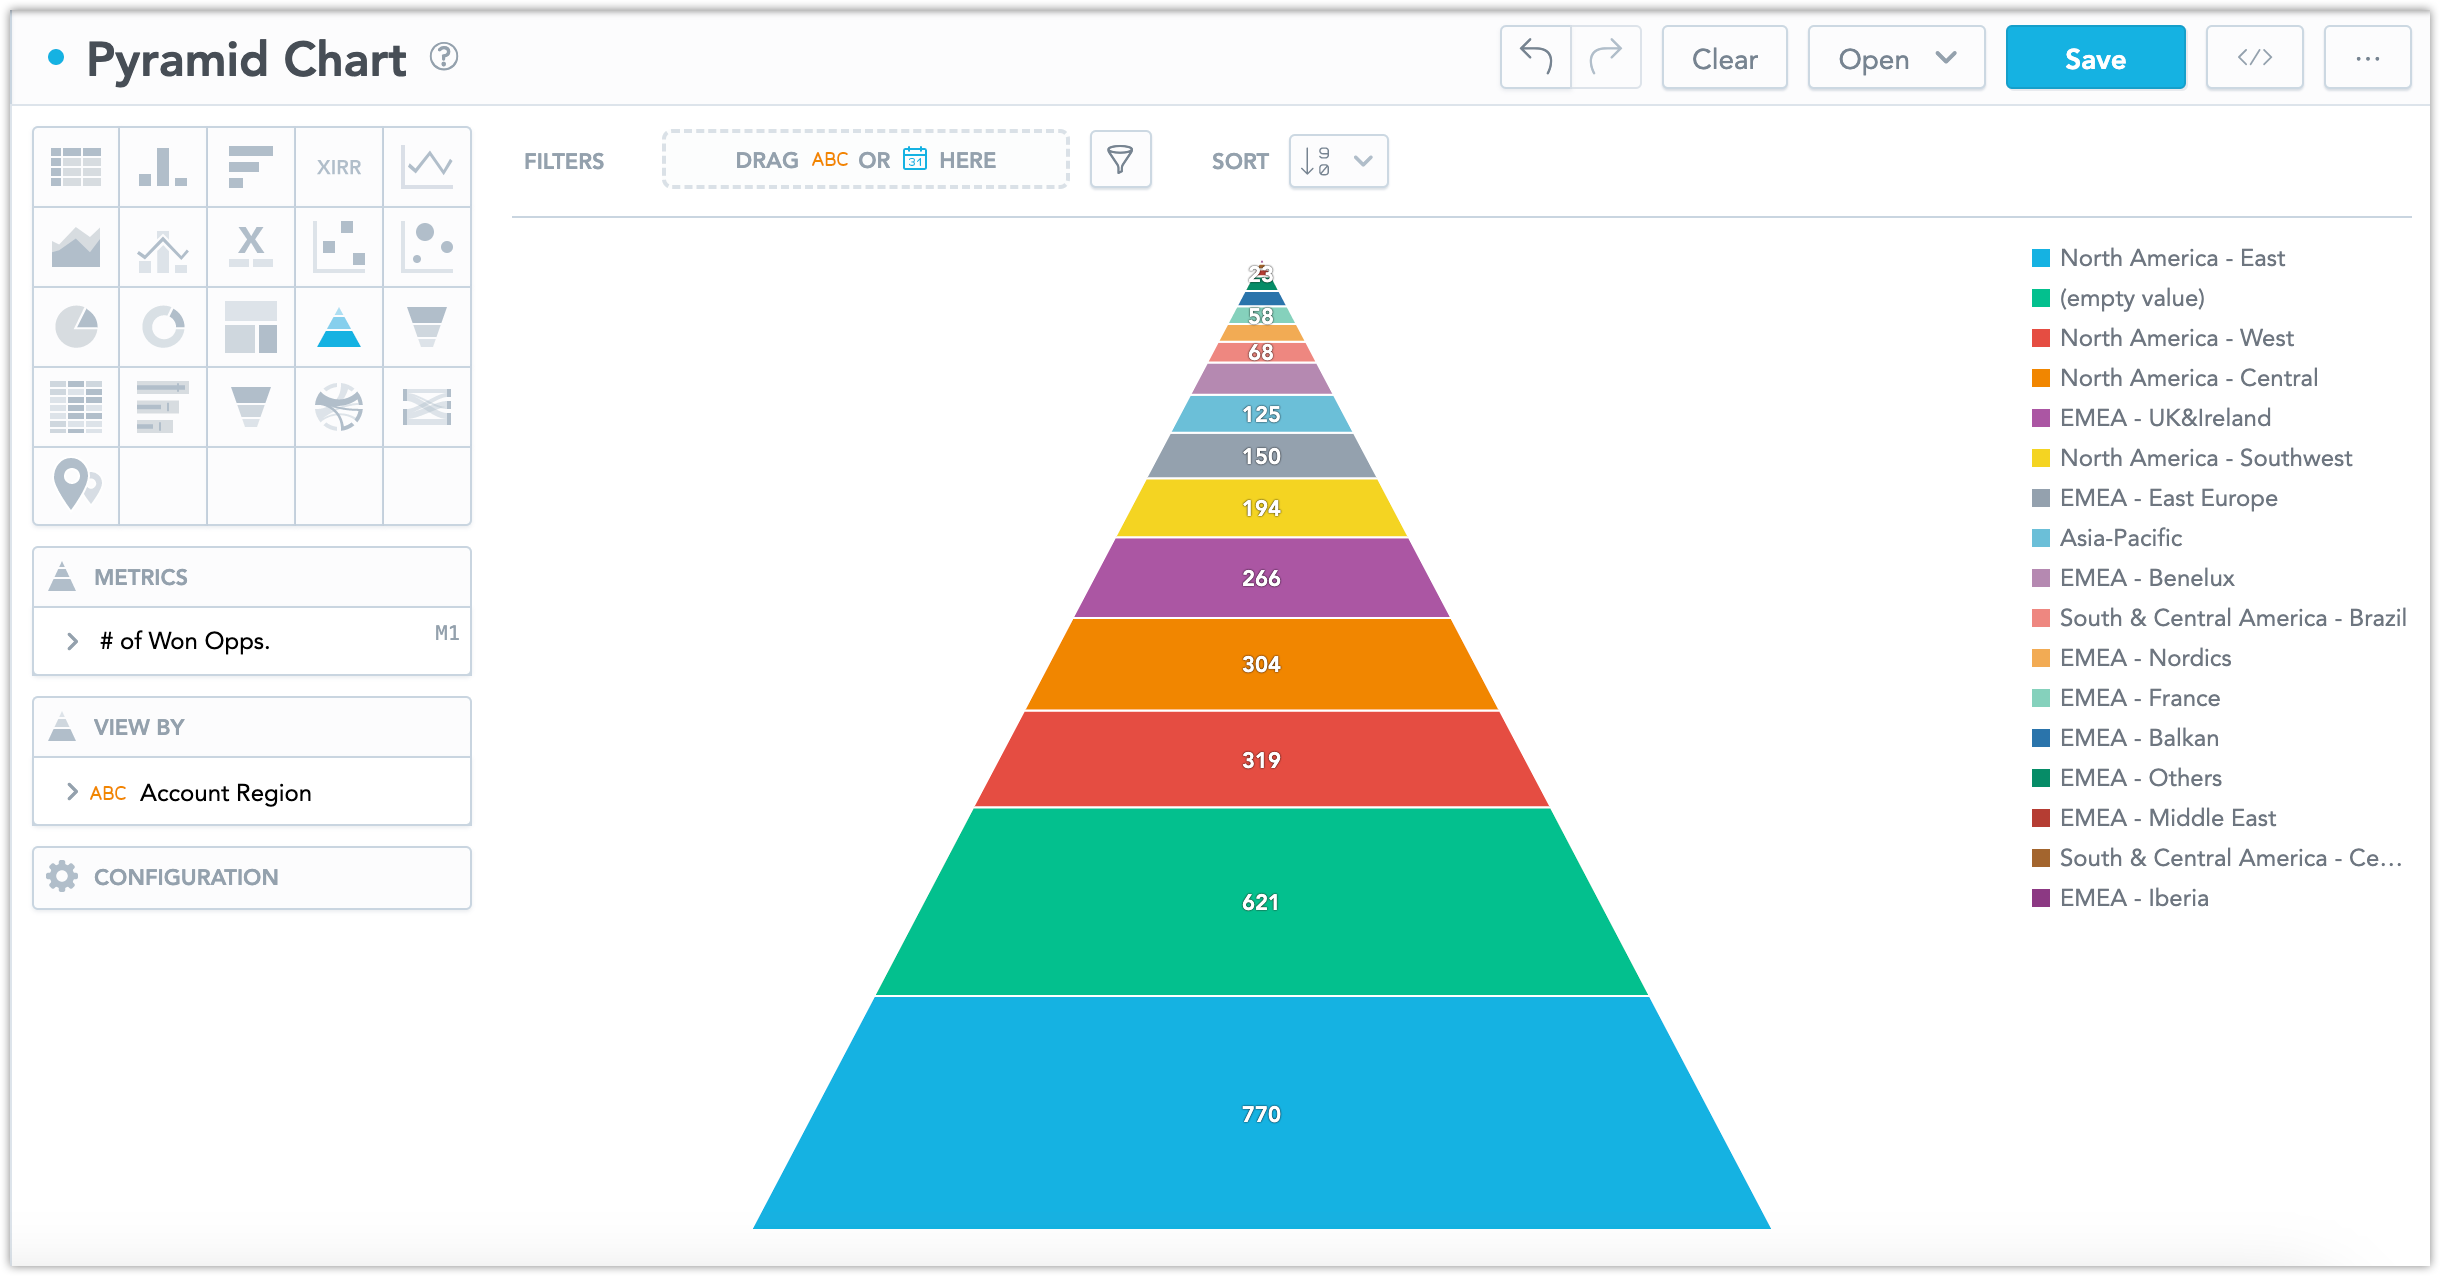
Pyramid Charts have the following sections:
- Metrics
- View By
- Configuration
For information about common characteristics and settings of all visualizations, see the Visualization Types section.