Review and Organize the Data Catalog
The Data Catalog in Analytical Designer contains metrics, facts or attributes that are available for your visualizations.
The Data Catalog has buttons to filter for data by their type metrics, facts or attributes.
To add items from the Data Catalog to your visualization, drag and drop them into the appropriate section in the visualization. For details about creating visualizations, see Create Visualizations.
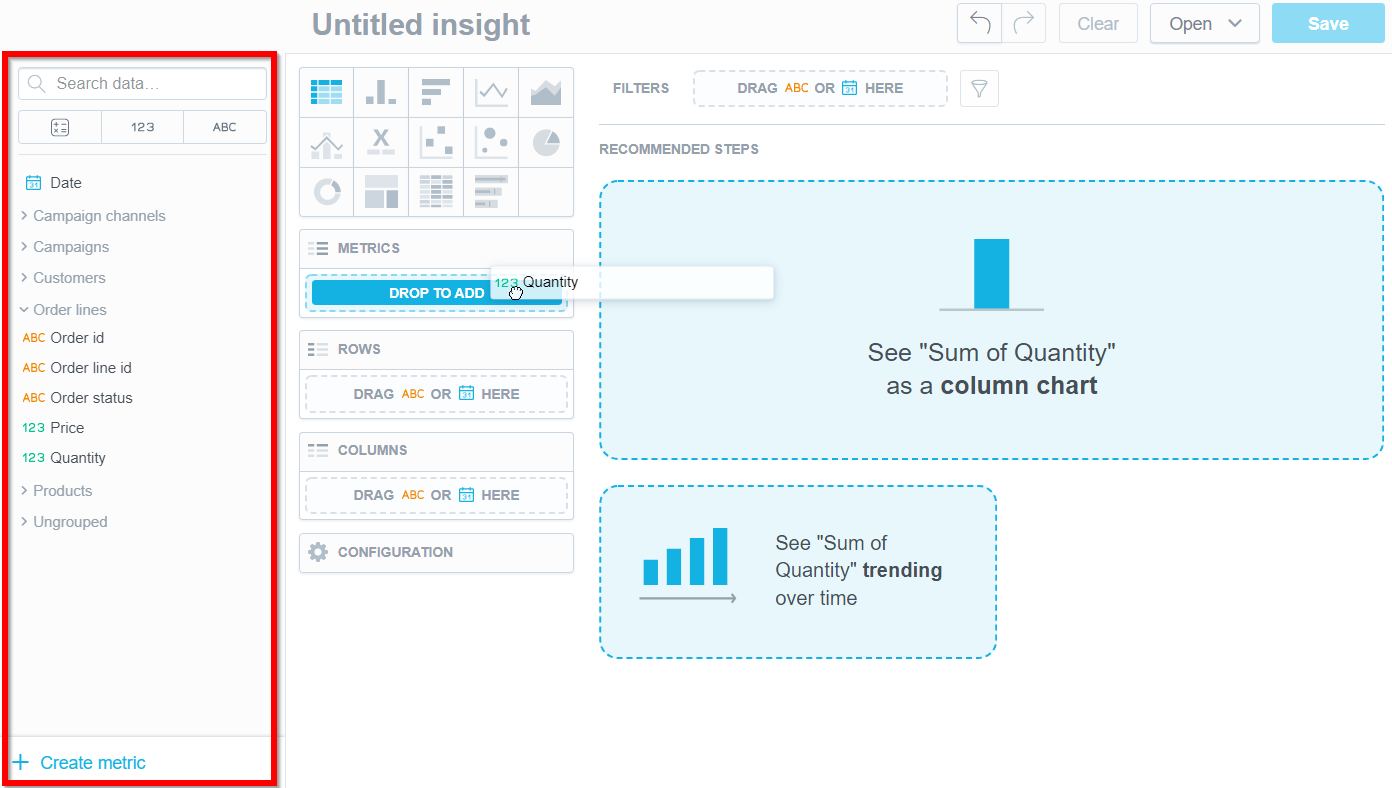
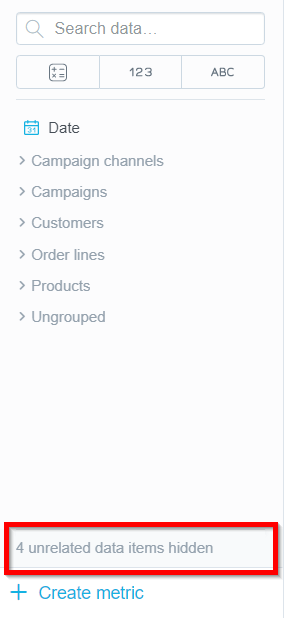
The Data Catalog displays only the items that are relevant to your visualization. The items that cannot be added are hidden. Analytical Designer then displays a message in the Data Catalog to inform you.
Organize the Data Catalog
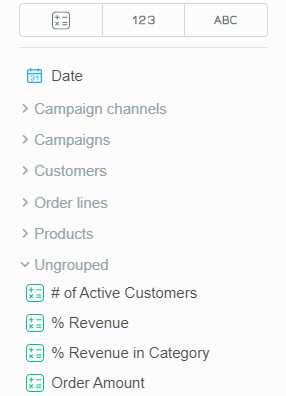
All metrics, facts and attributes in the Data Catalog are sorted alphabetically in a single list. Use tags if you want to add an item to one or multiple groups.
Groups and items within the groups are sorted alphabetically. The items that do not belong to any group are displayed in
Ungrouped.Ungroupedis always the last group in the list.
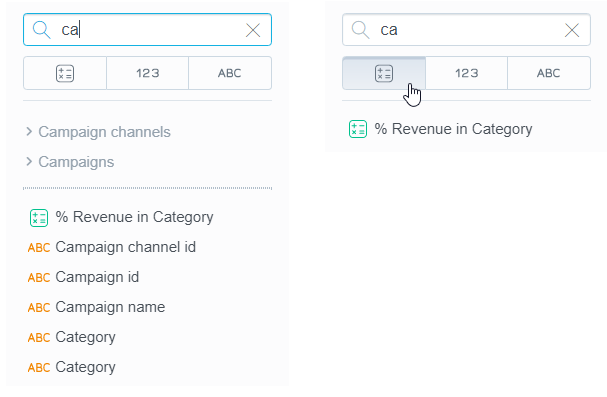
Search for Items
Use the search bar in the Data Catalog to search for the metrics and attributes that you need.
Analytical Designer scans all the item names and displays any item that contains your search string.
If you organize your catalog, Analytical Designer scans also the group names. When you switch to another tab, the search results adjust to correspond with the items to be displayed in that tab.