Use Smart Functions
Smart functions represent our effort to leverage advanced statistical methods to help you gain more insights from your data with just a click of a button.
Forecasting
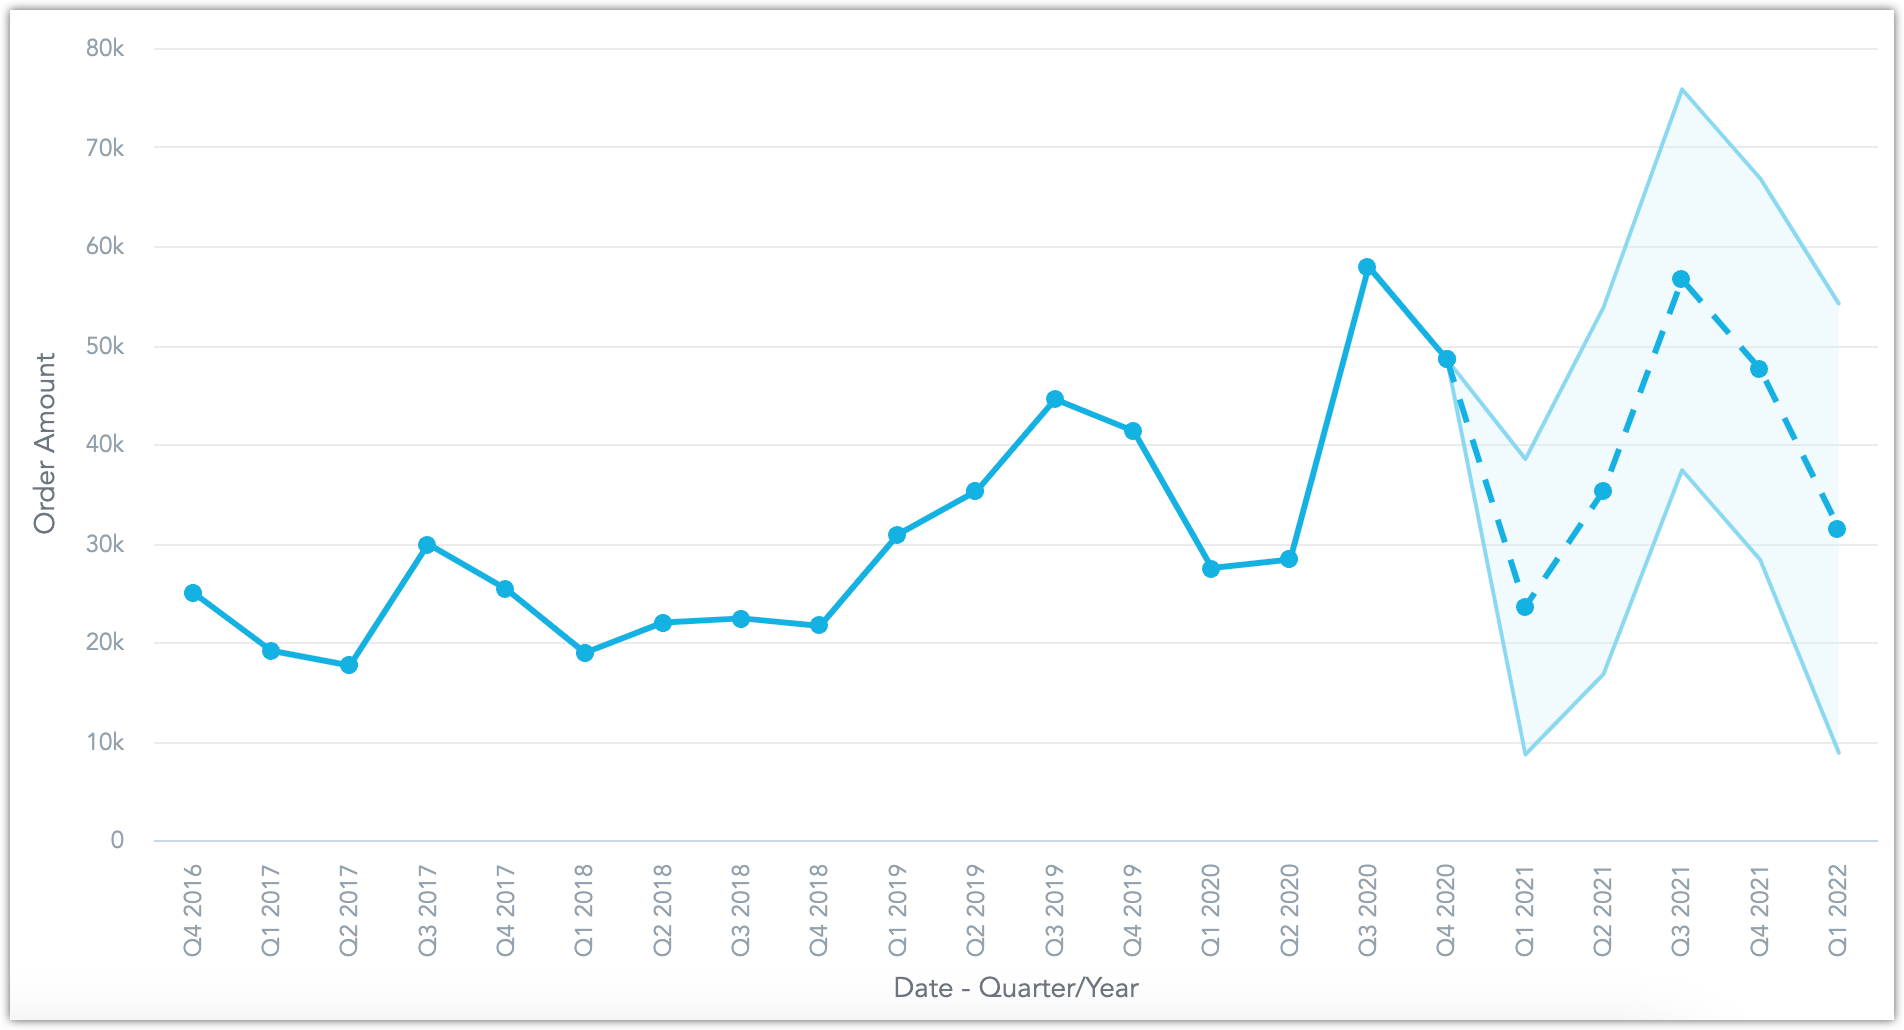
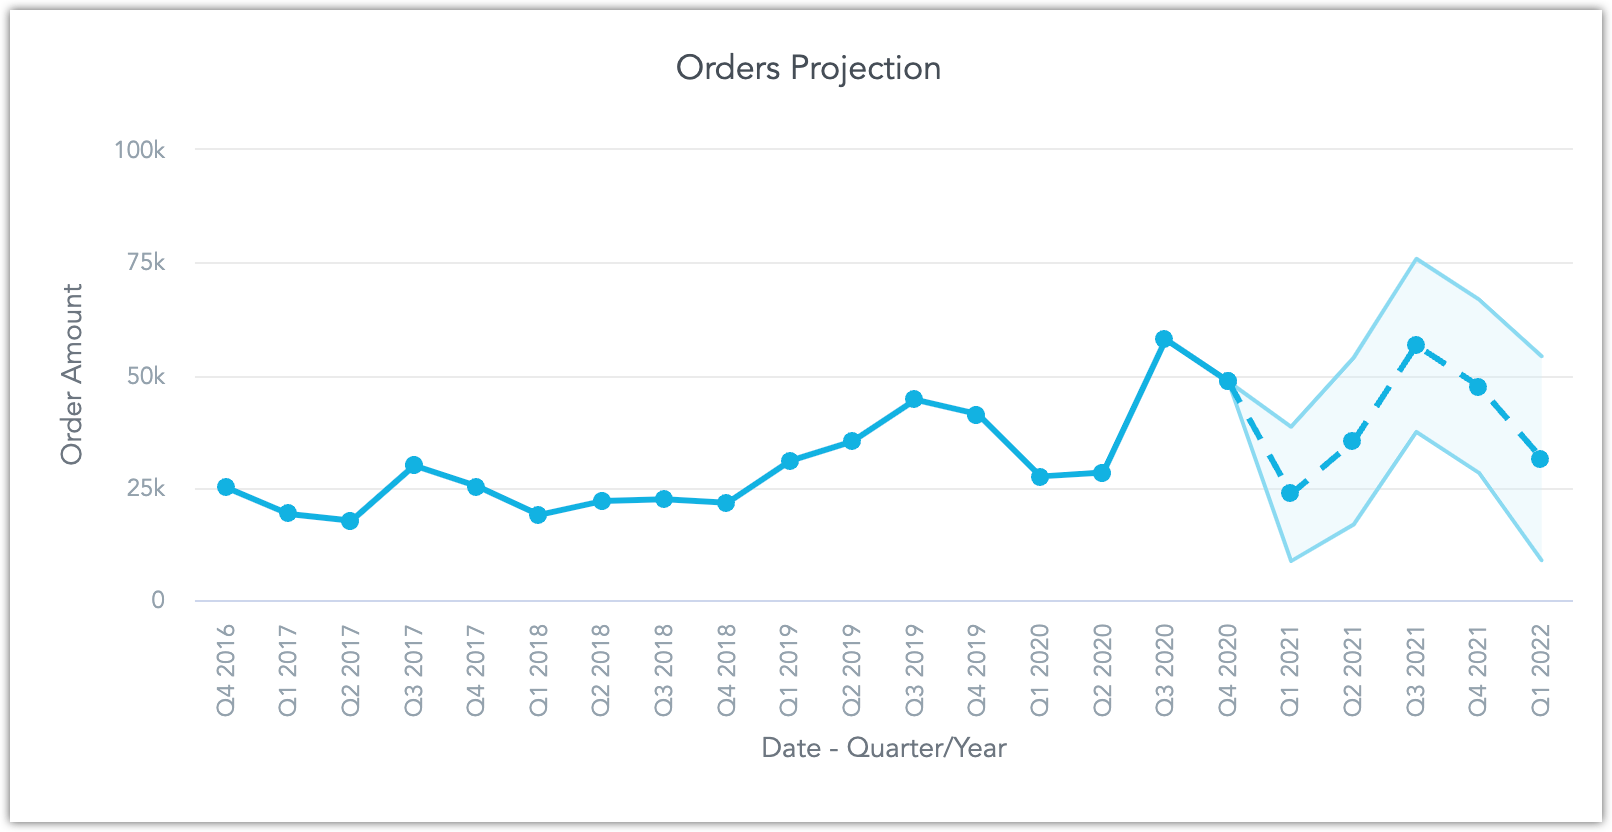
This function uses an autoregressive AR-X(p) model to create forecasts of future trends based on your data.
Currently, forecasting is supported only for line charts.
Steps:
Create or open a line chart visualization in the Analytical Designer.
Ensure that:
You are using only one metric and trending it by date.
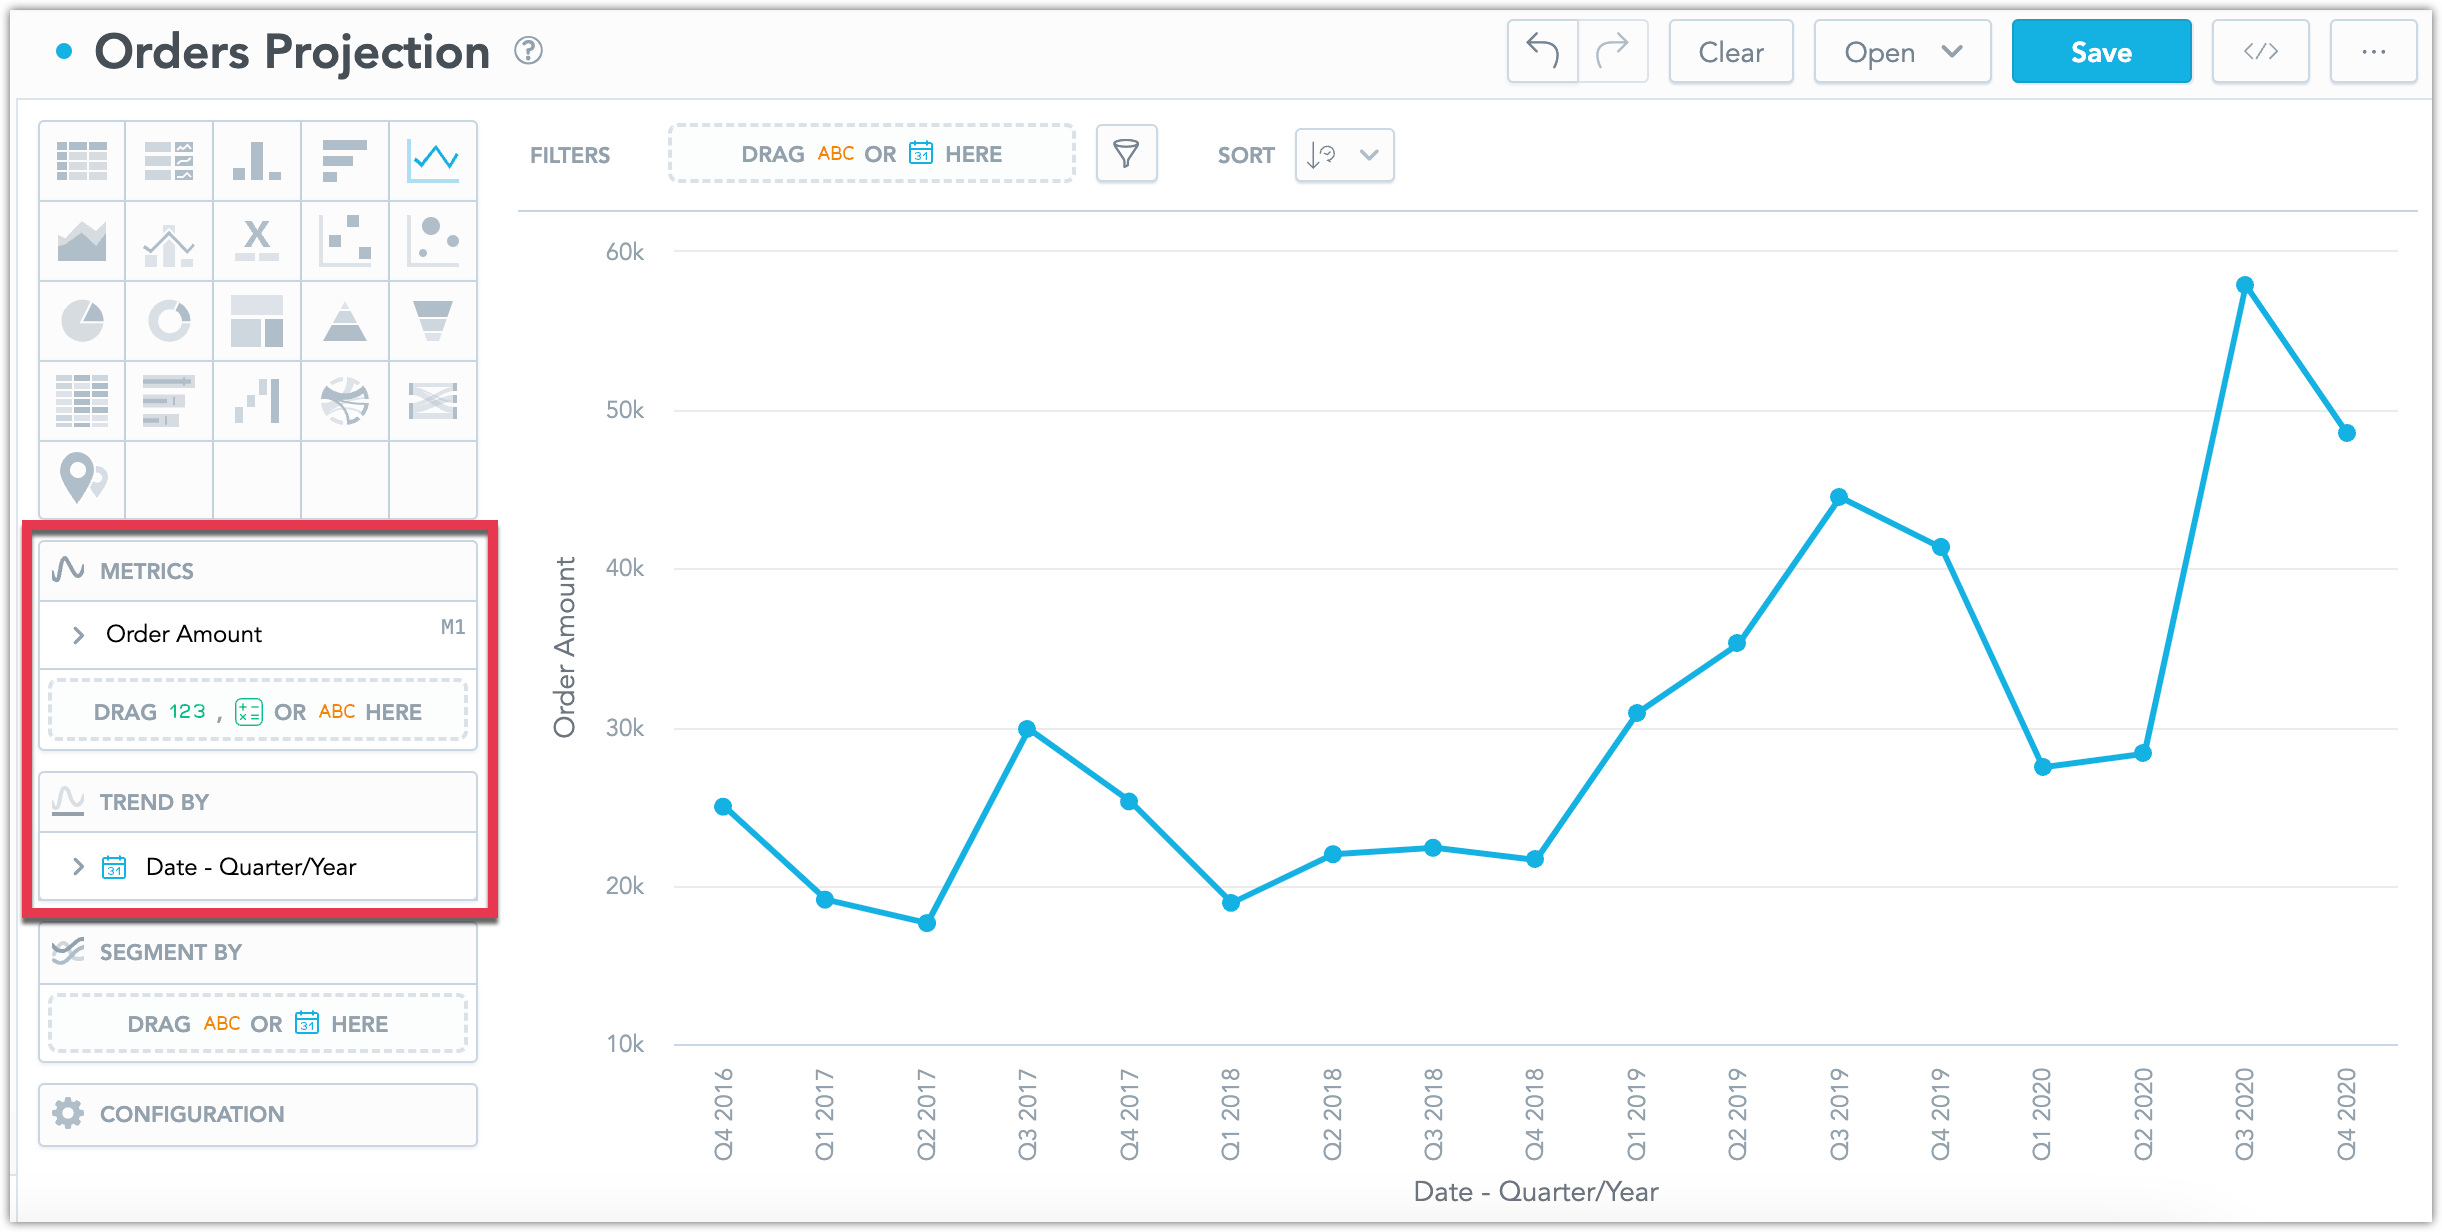
The data contains no missing values.
Under Configuration, toggle on Forecasting.
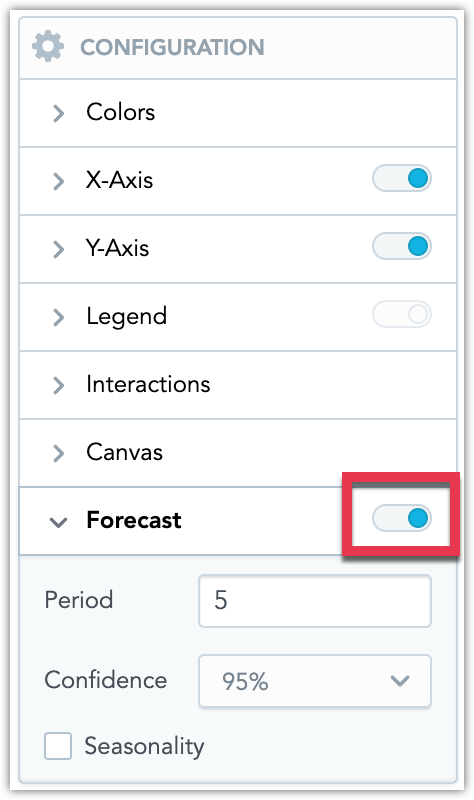
The number of predicted Periods must be smaller than the number of displayed data points.
The Confidence level determines the size of the shaded error region. A 95% confidence level means that the shaded region should be large enough to contain the predicted future data point 95% of the time.
Turn on Seasonality if your data is highly periodic to increase the accuracy of the forecast. For example, if your ice cream sales reliably grow every summer and plummet every winter. Note that if you enable this option, the number of predicted periods should be significantly smaller than the number of displayed data points.