Schedule Exports in Dashboards
Experimental Feature
This is an experimental feature available to trial users. It is in active development and may be significantly changed or removed.
You can set up automated exports that send the dashboard and visualization as a PDF file (or also as XLSX file, in case of visualizations) via a webhook at regularly scheduled intervals. These webhooks can be used to integrate with automated email services or workflow automation platforms by triggering events upon delivery.
For example, when a dashboard is exported and sent via a webhook, it can automatically trigger an email containing the PDF to a designated recipient list, keeping stakeholders informed.
Alternatively, the webhook can initiate a workflow automation process, such as uploading the PDF to a shared storage service or updating a project management tool with the latest data. The TTL for attachments is set to 120 seconds.
To set up scheduled exports:
The administrator needs to set up one or more webhooks, see Create Webhook.
The administrator then needs to handle what happens with the webhook’s JSON payload once it is sent to the service endpoint of the third-party service.
Dashboard users can open any dashboard and create a scheduled export using one of the webhooks, see Schedule Export.
Create Webhook
As the administrator, you need to create one or more webhooks to an email API or workflow automation service of your choice. When a scheduled export is triggered, GoodData sends a JSON payload via the webhook.
You can use webhook.site for testing webhooks and capturing HTTP requests.
Steps:
Go to Settings.
Under Destinations > Webhooks, click Manage.
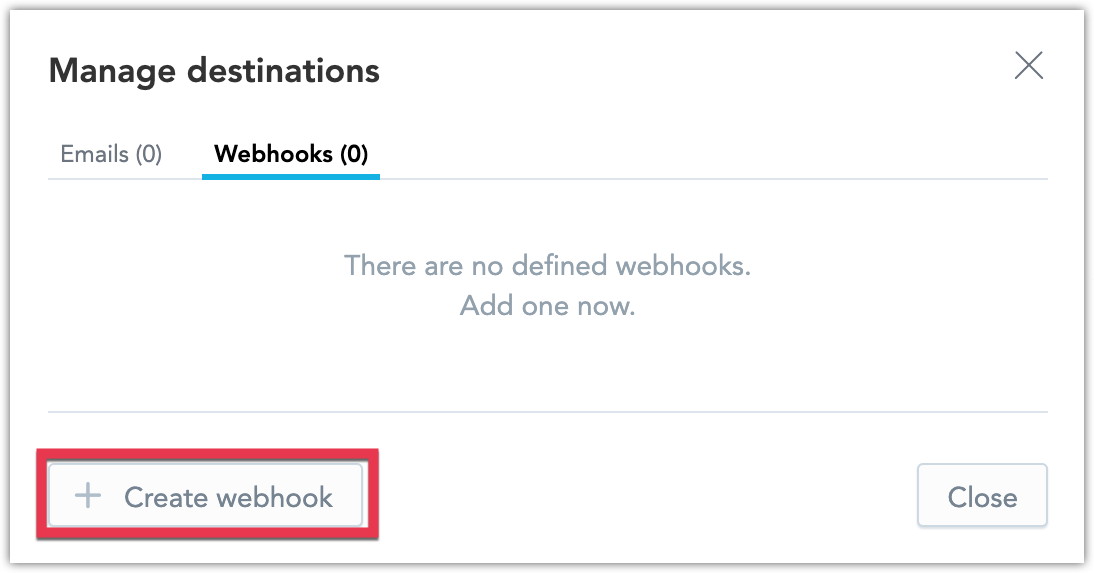
Click + Create.
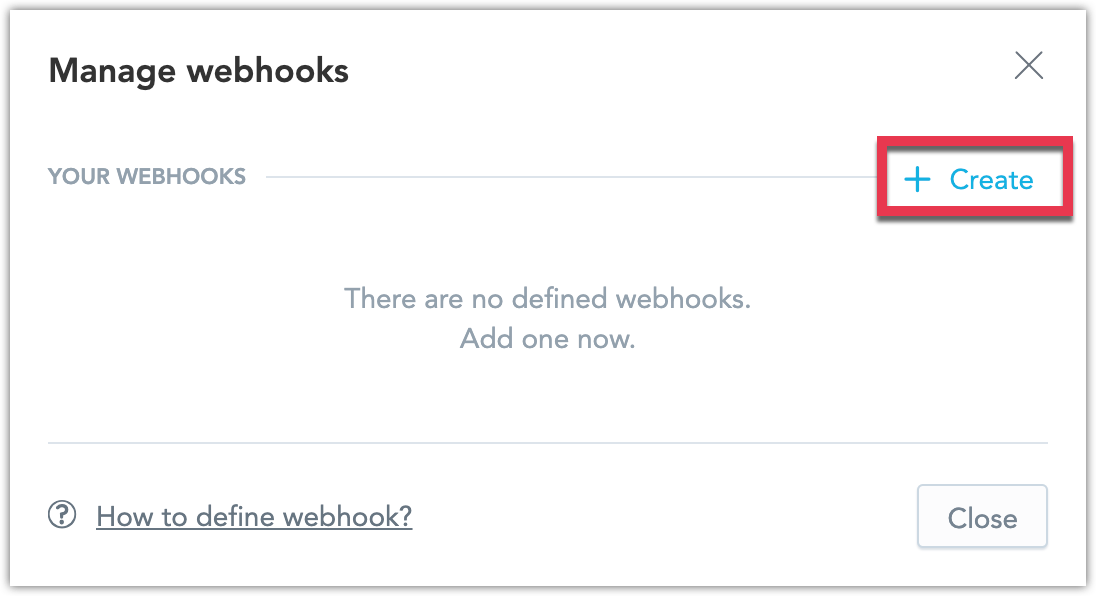
Configure where you want the payload to be sent. If your endpoint requires a bearer authentication token, add it as well. Once configured, click Create.
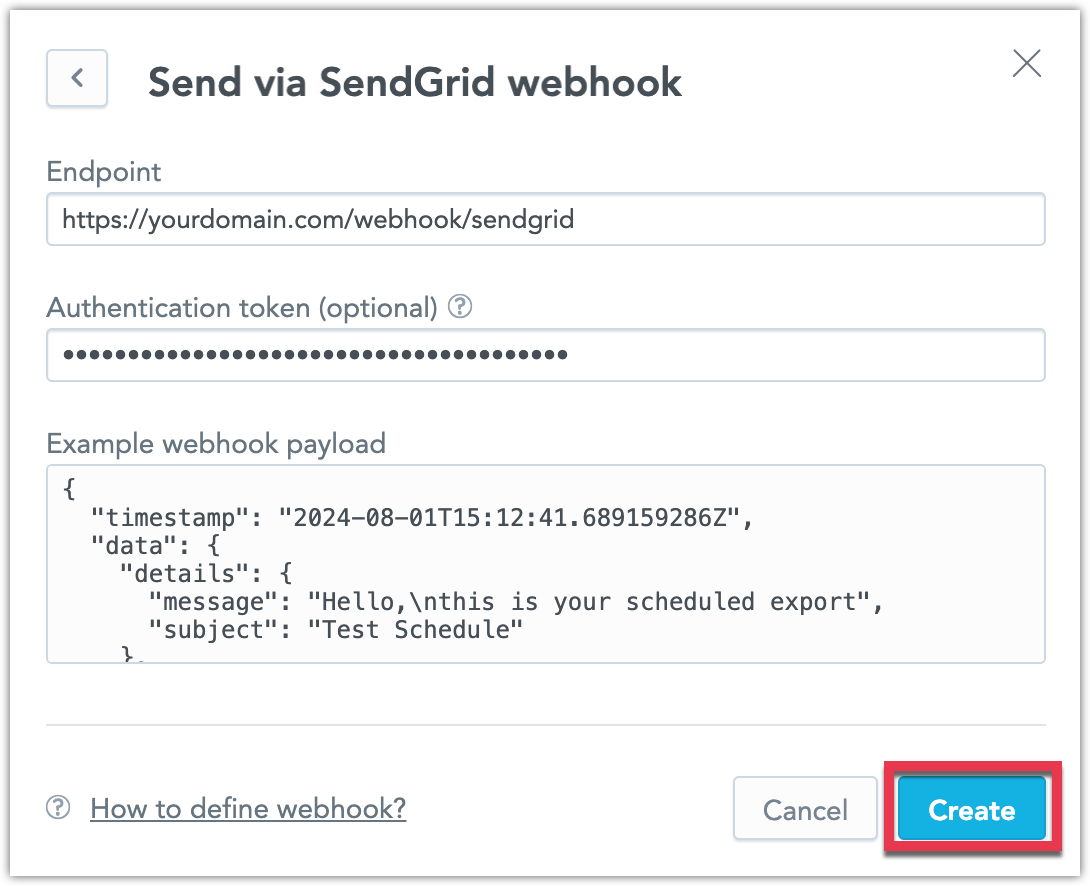
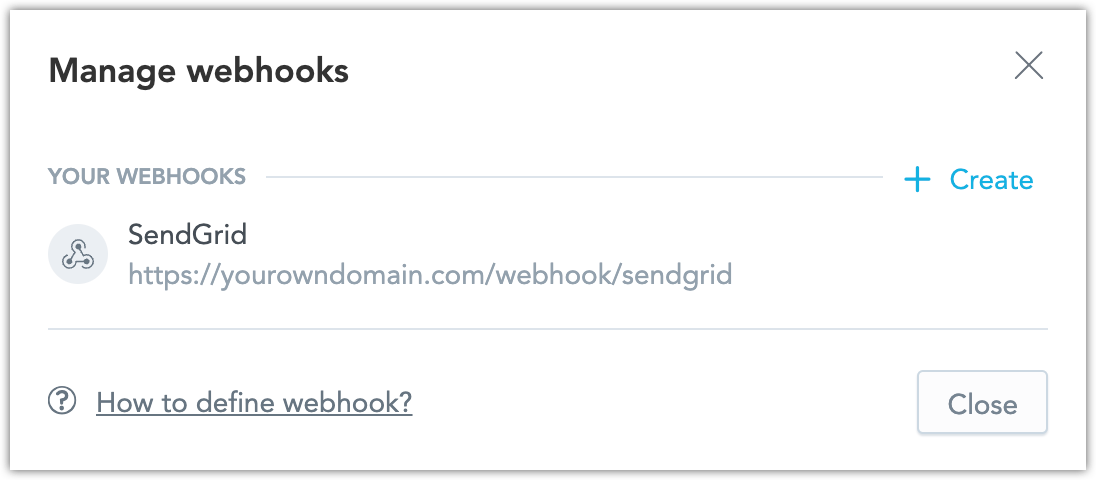
The webhook is created.
Payload
The payload we send follows this pattern:
{
  "timestamp": "2024-08-01T15:12:41.689159286Z",
  "data": {
    "details": {
      "message": "Hello,\nthis is your scheduled export",
      "subject": "Test Schedule"
    },
    "visualExports": [
      {
        "exportId": "<export_id>",
        "status": "DONE",
        "fileUri": "<presigned_generated_url>",
        "traceId": "ec020036de43"
      }
    ],
    "automation": {
      "id": "<destination_id>",
      "title": "Webhook test",
      "dashboardURL": "<host_url>/dashboards/#/workspace/<workspace_id>/dashboard/<dashboard_id>"
    },
    "recipients": [
      {
        "email": "jane.doe@gooddata.com",
        "id": "<user_id>"
      }
    ],
    "remainingActionCount": 123
  },
  "type": "automation-task.completed"
}
Note that visualExports is used in case of a dashboard export, and tabularExports in case of a visualization export.
Error Payload
If an error occurs, we send an error payload that follows this pattern:
{
  "timestamp": "2024-07-08T08:38:22.123200127Z",
  "data": {
    "details": {
      "title": "example"
    },
    "tabularExports": [
      {
        "exportId": "5a422124df0c1342543b95ea1fcc5b8903a9cb2c_6d0f982638b2f84c3e7e5a7fc5d79550d0cb3af1",
        "status": "ERROR",
        "errorMessage": "Export failed due to internal exception",
        "traceId": "134839eff3e9515c"
      },
      {
        "exportId": "5a422124df0c1342543b95ea1fcc5b8903a9cb2c_435fdc30f52a8f04d299bcea726d1f5705f3fafe",
        "status": "ERROR",
        "errorMessage": "Export failed due to internal exception",
        "traceId": "134839eff3e9515c"
      }
    ]
  },
  "type": "automation-task.completed"
}
Schedule Export
Once one or more webhooks are created, dashboard users can schedule exports by selecting an available webhook. The user must have Workspace.ANALYZE permission for the workspace containing the dashboard to schedule an export.
Steps:
Open a dashboard.
In the top right corner, click the … button and select Schedule export.
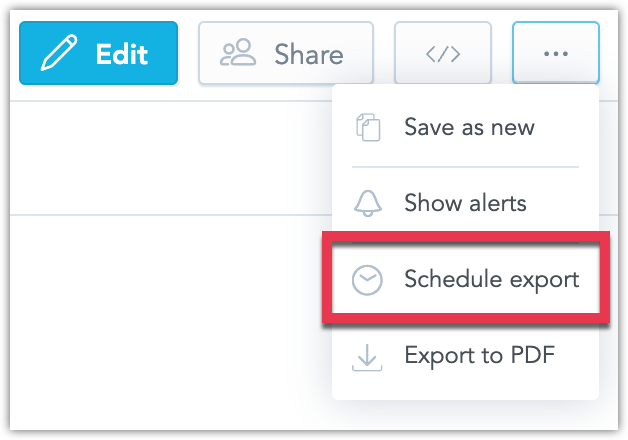
The scheduled export creation dialog opens.
Choose the frequency of the dashboard export, specify the email addresses to send it to, and set the title and body of the email. Then click Create.
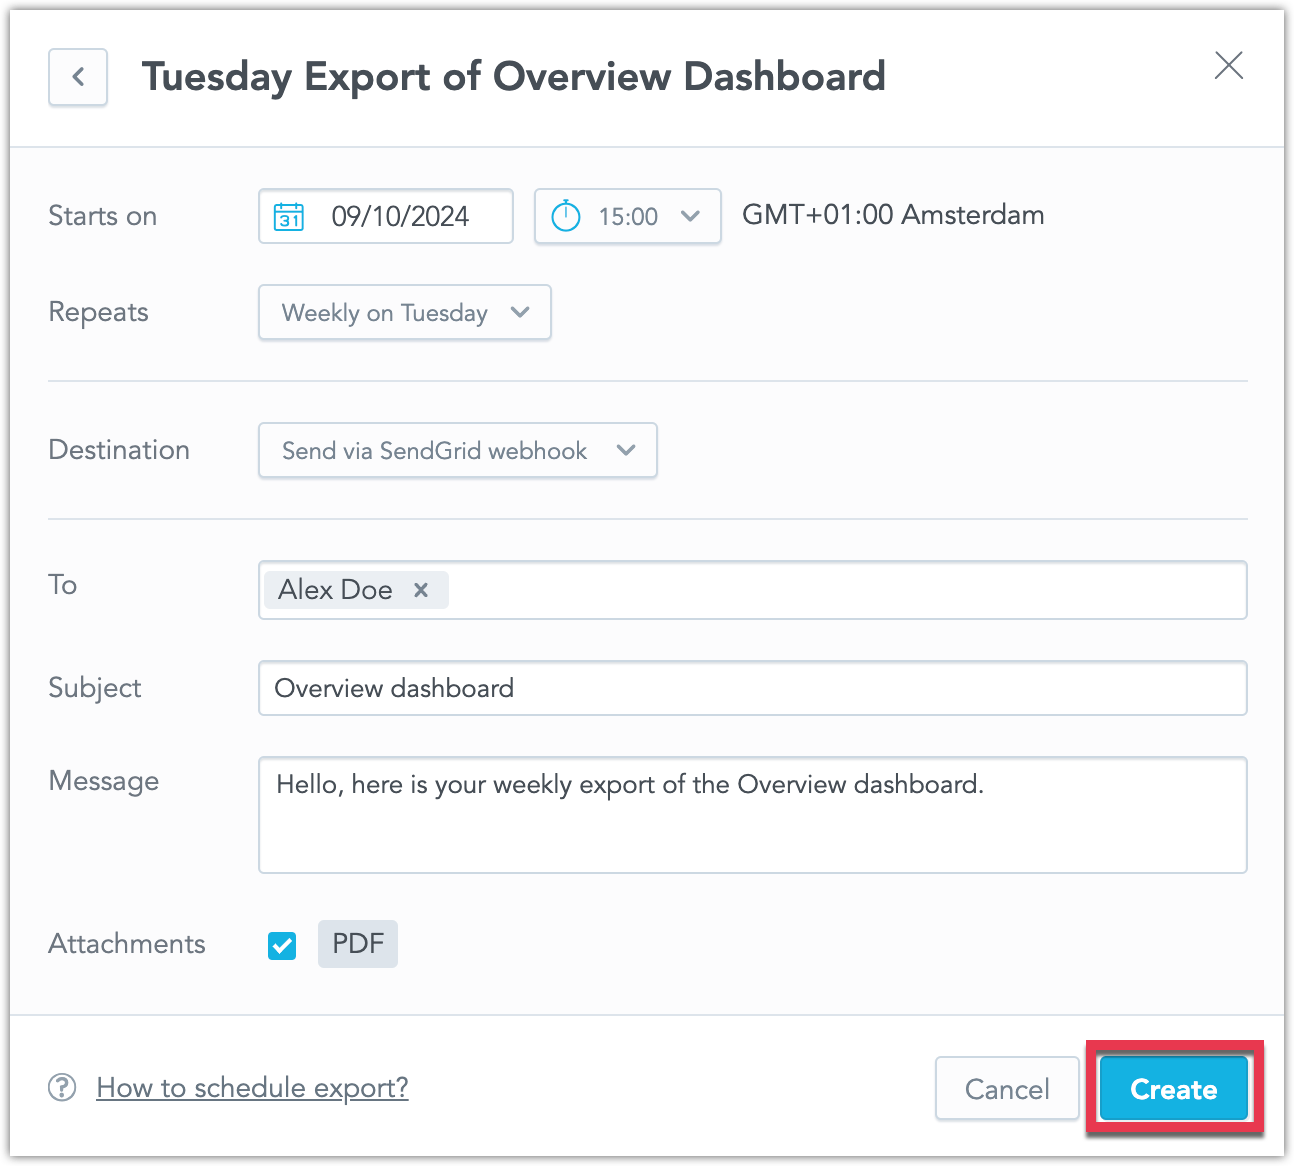
Your automated PDF export is scheduled.

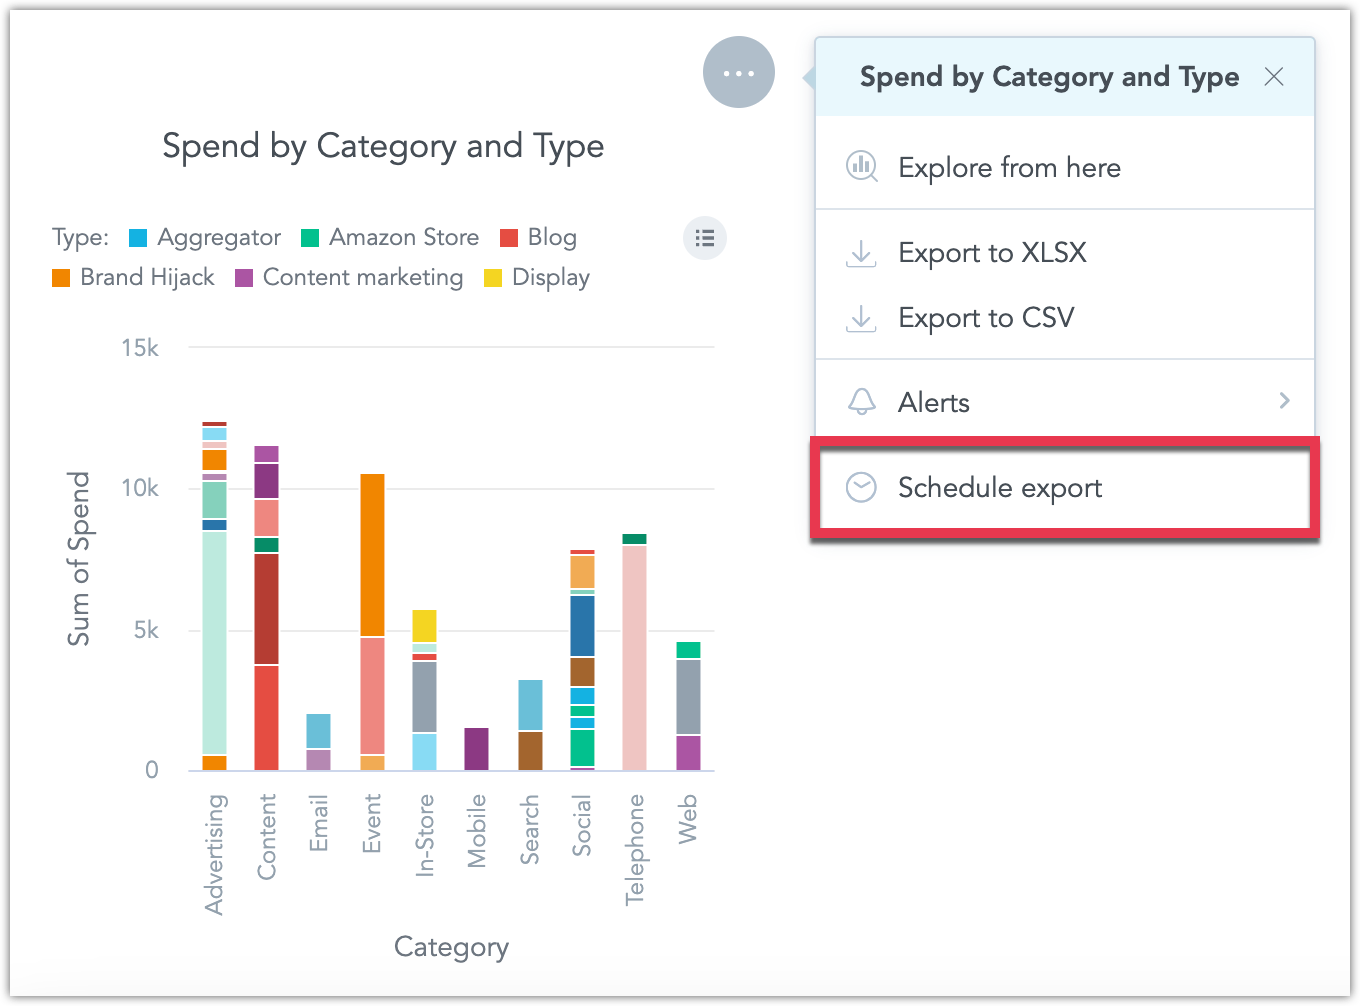
Export Visualizations
Scheduling an export of an individual visualization works similarly to scheduling a dashboard export. To start, click on the … menu of the visualization and select Schedule export:
The scheduled export dialog appears identical to the one used for dashboards, with an additional option to export the visualization in XLSX format:
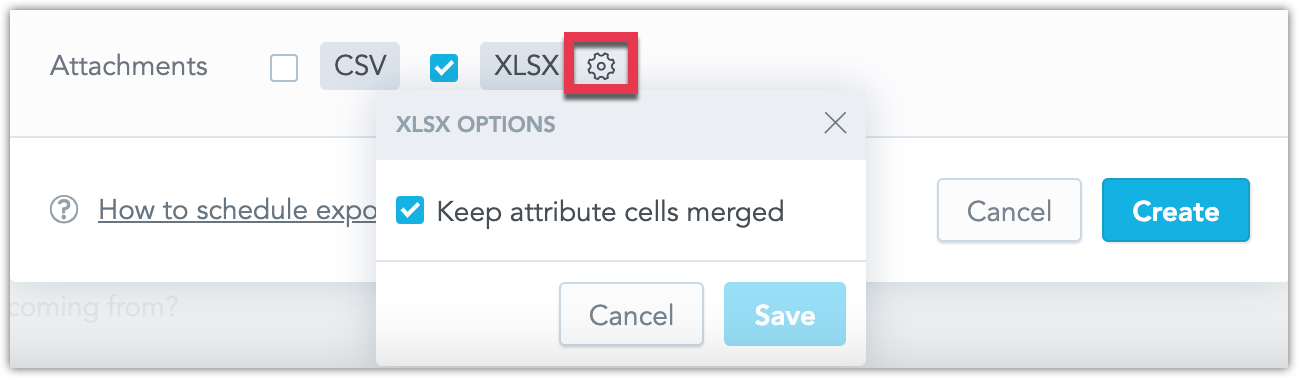
There is also an option to disable the automatic merging of attribute cells. For example, by default, an exported visualization in XLSX format might look like this:
| Continent | Country |
|---|---|
| Europe | France |
| Germany |
If you disable the Keep attribute cells merged option, the XLSX table will look like this:
| Continent | Country |
|---|---|
| Europe | France |
| Europe | Germany |
Filters
When creating a scheduled export, the active dashboard filters are saved as part of the scheduled export, and all exports will use those filter values. If you wish to disable this behavior, click the edited dashboard filters text and toggle Use default filters:
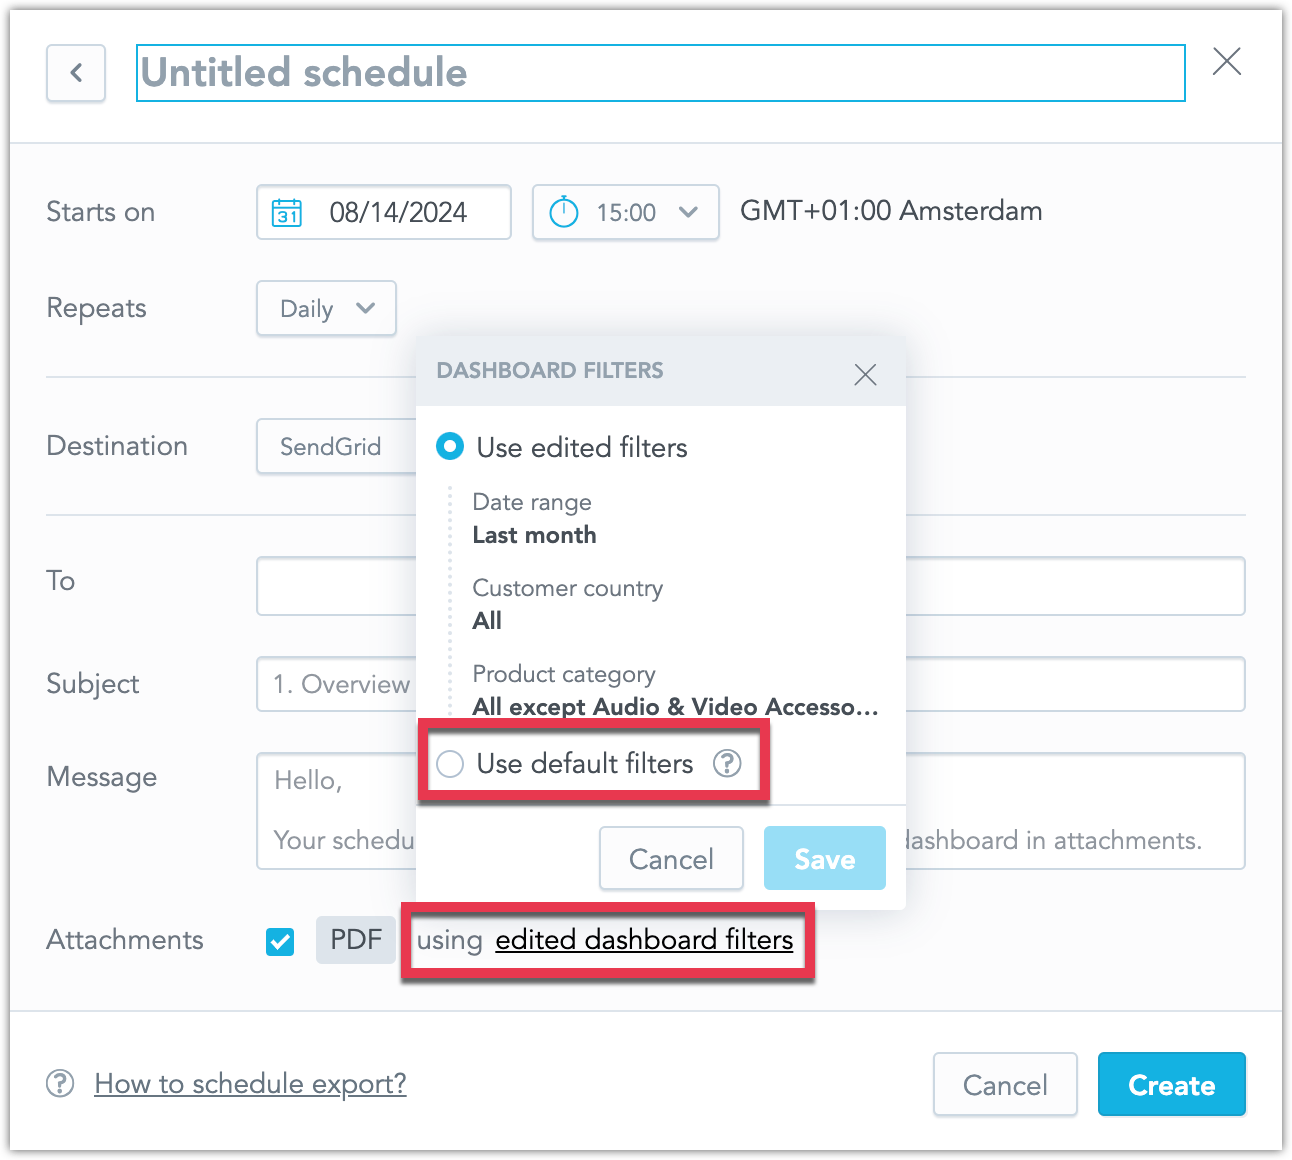
In this case, the default filters will be used. Note that if the dashboard’s default filter values are changed in the future, these new filter values will NOT be applied to this scheduled export.