Create Alerts in Dashboards
In dashboards, you can set up alerts to monitor key metrics and receive notifications when specific conditions are met. Alerts are triggered by changes in metric values, allowing you to stay informed about important updates without the need for constant monitoring.
Admin Setup Required
Before you can create alerts, your administrator must configure one or more destinations and ensure you have the necessary workspace permissions, as described in Automation in Dashboards.
Delivery Methods
When an alert is triggered, the notification will be delivered based on the selected destination. If an email destination is chosen, you’ll receive a structured email notification:

Custom Email Appearance
Your organization’s white-labeling and customization settings may alter the appearance of the email, as defined by your administrator. For more information, see Customize Emails.
Alternatively, if a webhook destination is selected, a JSON payload will be sent to the webhook for further processing in external systems, managed by the administrator.
Create Alert
Follow the steps below to set up a new alert for a dashboard widget.
Steps:
Open a dashboard.
Hover over a widget, click the … button and select Alerts.
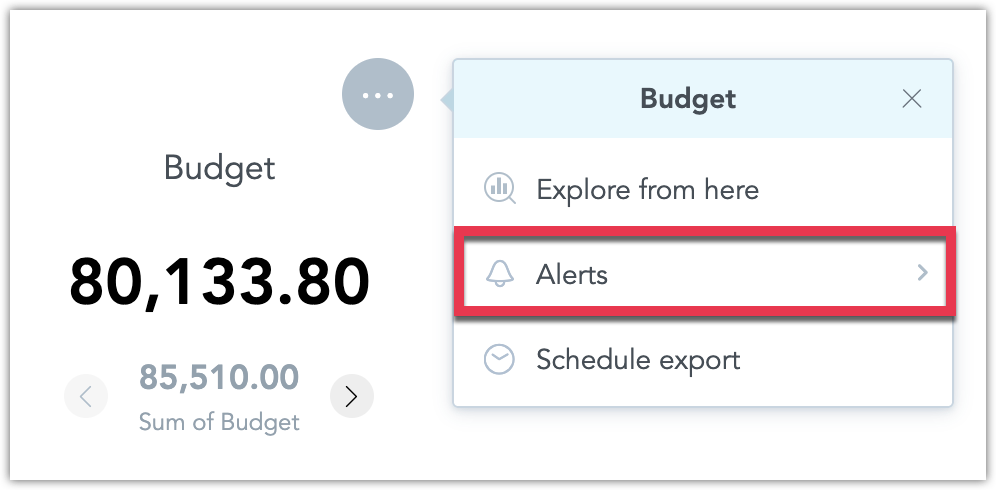
The alert creation dialog opens.
Configure the alert’s condition, metric, and destination.
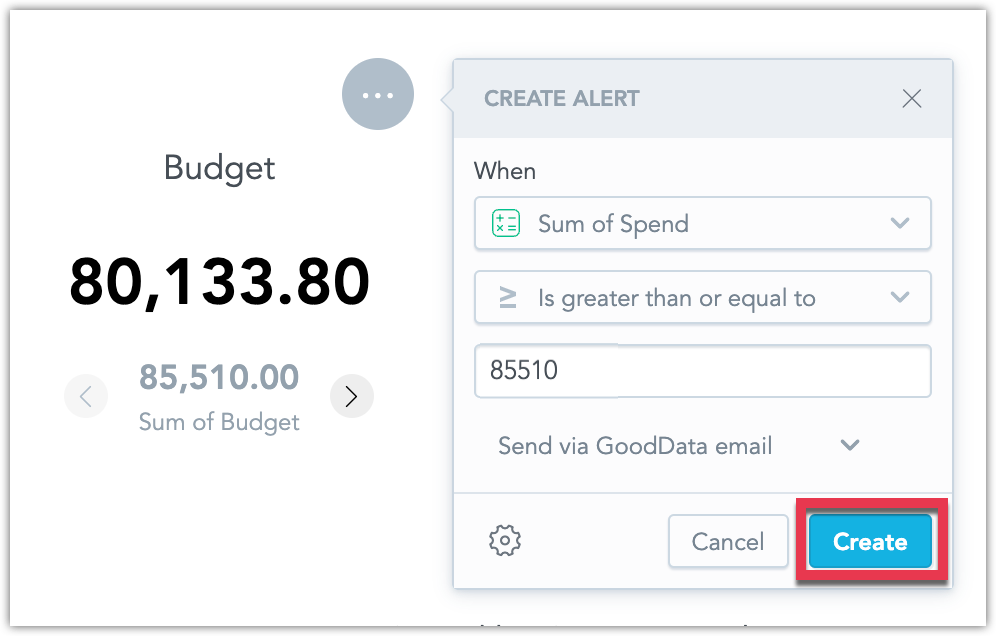
Click the cogwheel button to configure the Trigger setting: The trigger can be set to send the alert every time alerts are evaluated, assuming the conditions are met, or trigger just once, after which the alert becomes paused.
Once configured, click Create.
Optionally you can then edit, pause, or unpause the alert from the widget:
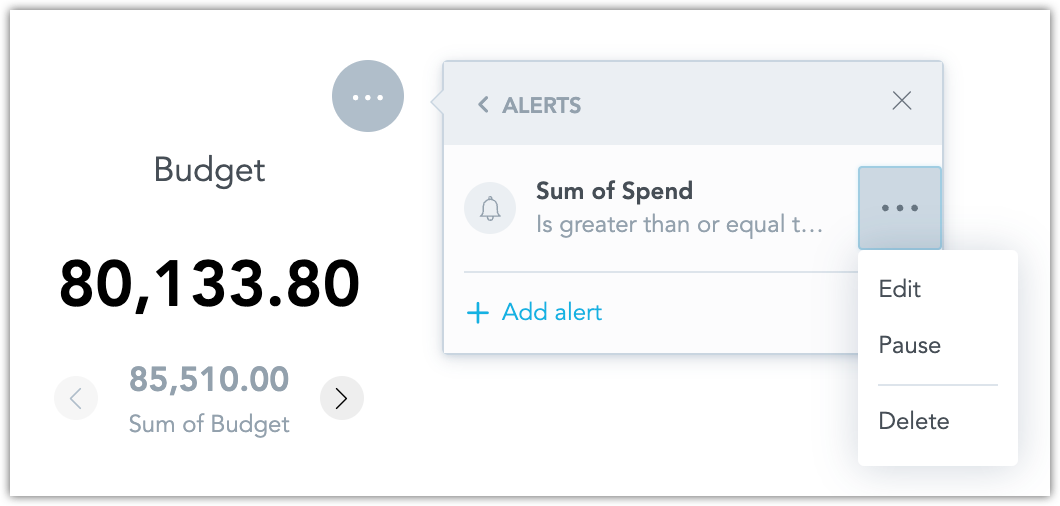
or the dashboard-wide alert list:

To create and manage alerts via the API, you can call the API endpoint /api/v1/entities/workspaces/<workspaceId>/automations using POST, GET, PATCH, DELETE, and PUT methods.
To create a new alert make the following API call:
curl $HOST_URL/api/v1/entities/workspaces/<workspace_id>/automations \
  -H "Content-Type: application/vnd.gooddata.api+json" \
  -H "Accept: application/vnd.gooddata.api+json" \
  -H "Authorization: Bearer $API_TOKEN" \
  -X POST \
  -d '{
    "data": {
      "type": "automation",
      "id": "<alert_id>",
      "attributes": {
        "title": "<alert_display_name>",
        "details": {
          "widgetName": "<widget_display_name>"
        },
        "state": "ACTIVE",
        "metadata": {
          "widget": "<widget_id>"
        },
        "alert": {
          "condition": {
            "comparison": {
              "operator": "<comparison_operator>",
              "left": {
                "localIdentifier": "<arbitrary_id>",
                "title": "<metric_display_name>",
                "format": "<metric_format>"
              },
              "right": {
                "value": <value_to_compare_to>
              }
            }
          },
          "execution": {
            "filters": [],
            "measures": [
              {
                "localIdentifier": "<arbitrary_id>",
                "definition": {
                  "measure": {
                    "item": {
                      "identifier": {
                        "id": "<metric_id>",
                        "type": "fact"
                      }
                    },
                    "aggregation": "<aggregation_type>"
                  }
                }
              }
            ]
          }
        }
      },
      "relationships": {
        "recipients": {
          "data": [
            {
              "type": "user",
              "id": "<user_id>"
            }
          ]
        },
        "notificationChannel": {
          "data": {
            "type": "notificationChannel",
            "id": "<destination_id>"
          }
        },
        "analyticalDashboard": {
          "data": {
            "type": "analyticalDashboard",
            "id": "<dashboard_id>"
          }
        }
      }
    }
  }'
a real-life example might look like this:
curl https://frosty-cat.trial.cloud.gooddata.com/api/v1/entities/workspaces/e45864d8057f40a09957ba1bdd3b5139/automations \
  -H "Content-Type: application/vnd.gooddata.api+json" \
  -H "Accept: application/vnd.gooddata.api+json" \
  -H "Authorization: Bearer ZWRtaG46Ym9vdHN1cmFwOkdkG05hczUaKm==" \
  -X POST \
  -d '{
    "data": {
      "type": "automation",
      "id": "27ef8942-8069-4b29-b2b1-c87d8632789f",
      "attributes": {
        "title": "Sum of Spend",
        "details": {
          "widgetName": "Budget"
        },
        "state": "ACTIVE",
        "metadata": {
          "widget": "c83caf8e-6f64-4119-89b8-a81103f71c14"
        },
        "alert": {
          "condition": {
            "comparison": {
              "operator": "GREATER_THAN_OR_EQUAL_TO",
              "left": {
                "localIdentifier": "04ca1d94cffb4feb9647db498d06a52c",
                "title": "Sum of Spend",
                "format": "#,##0.00"
              },
              "right": {
                "value": 85510
              }
            }
          },
          "execution": {
            "filters": [],
            "measures": [
              {
                "localIdentifier": "04ca1d94cffb4feb9647db498d06a52c",
                "definition": {
                  "measure": {
                    "item": {
                      "identifier": {
                        "id": "spend",
                        "type": "fact"
                      }
                    },
                    "aggregation": "SUM"
                  }
                }
              }
            ]
          }
        }
      },
      "relationships": {
        "recipients": {
          "data": [
            {
              "type": "user",
              "id": "alex.doe"
            }
          ]
        },
        "notificationChannel": {
          "data": {
            "type": "notificationChannel",
            "id": "a5b13b1b-4e60-4a6d-bba6-9b2b4ec96918"
          }
        },
        "analyticalDashboard": {
          "data": {
            "type": "analyticalDashboard",
            "id": "2f0b76a1-9e8e-4375-84be-721919e03cb7"
          }
        }
      }
    }
  }'
Filters
When creating an alert, the active dashboard filters are saved as part of the alert, and the alert will be displayed and triggered based on those filters.
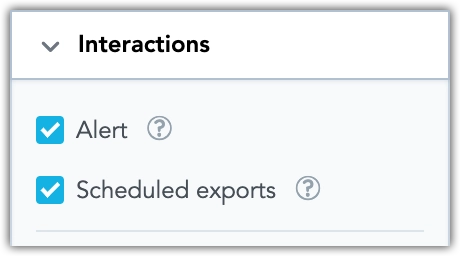
Disabling
You can disable the ability to create new alerts for a specific visualization by editing it in the Analytical Designer. To do this, go to the Interactions tab while editing the visualization: