Use Date Filter on Dashboards
You can filter dashboards by date or any attribute available in your workspace. The filters that you select then apply to all visualizations on the dashboard.
The dashboards date filter enables you to filter your data by:
- All time that includes all available data
- Static period where you specify an exact range including time:
1/1/2022 09:00 - 30/6/2022 17:00 - Relative period where you specify a range that is relative to today and changes in time:
from last week to tomorrow,from 5 hours ago to 2 hours ahead. - Predefined periods for minutes, hours, days, weeks, months, quarters, and years relative to today:
last 15 minutes,last 2 quarters,this month,last 2 years
The time format (12h or 24h) is based on your operating system settings.
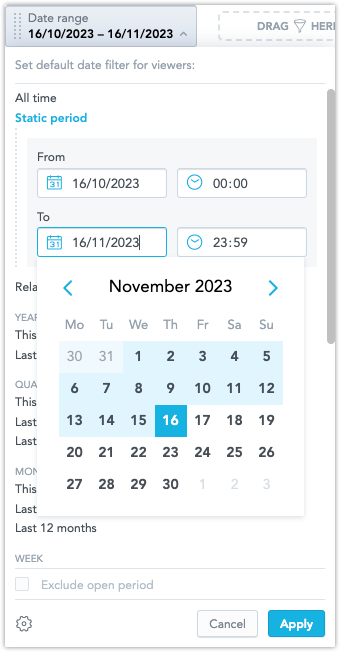
Static Period
You can filter your dashboard data by a fixed time period, from a specific date to a specific date.
Steps:
- Click Date range in the top bar.
- Click Static period.
- Set the dates.
- Click Apply.
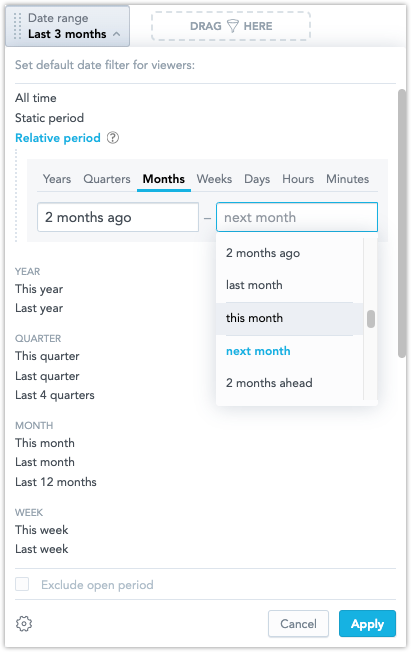
Relative Period
The relative period filter enables you to filter your data using ranges of time that are relative to the current date.
For example, you can filter from the last 2 months to the next 3 months using the current date as the starting point for the calculation.
Steps:
Click Date range in the top bar.
Click Relative period.
Select granularity - days, months, quarters, or years.
Set the range:
- From the dropdown menu, select the specific range. You can scroll up/down to display more options.
- Write a number to display specific options.
- Use the following keywords: yesterday/today/tomorrow for days or next/this/last for other periods.
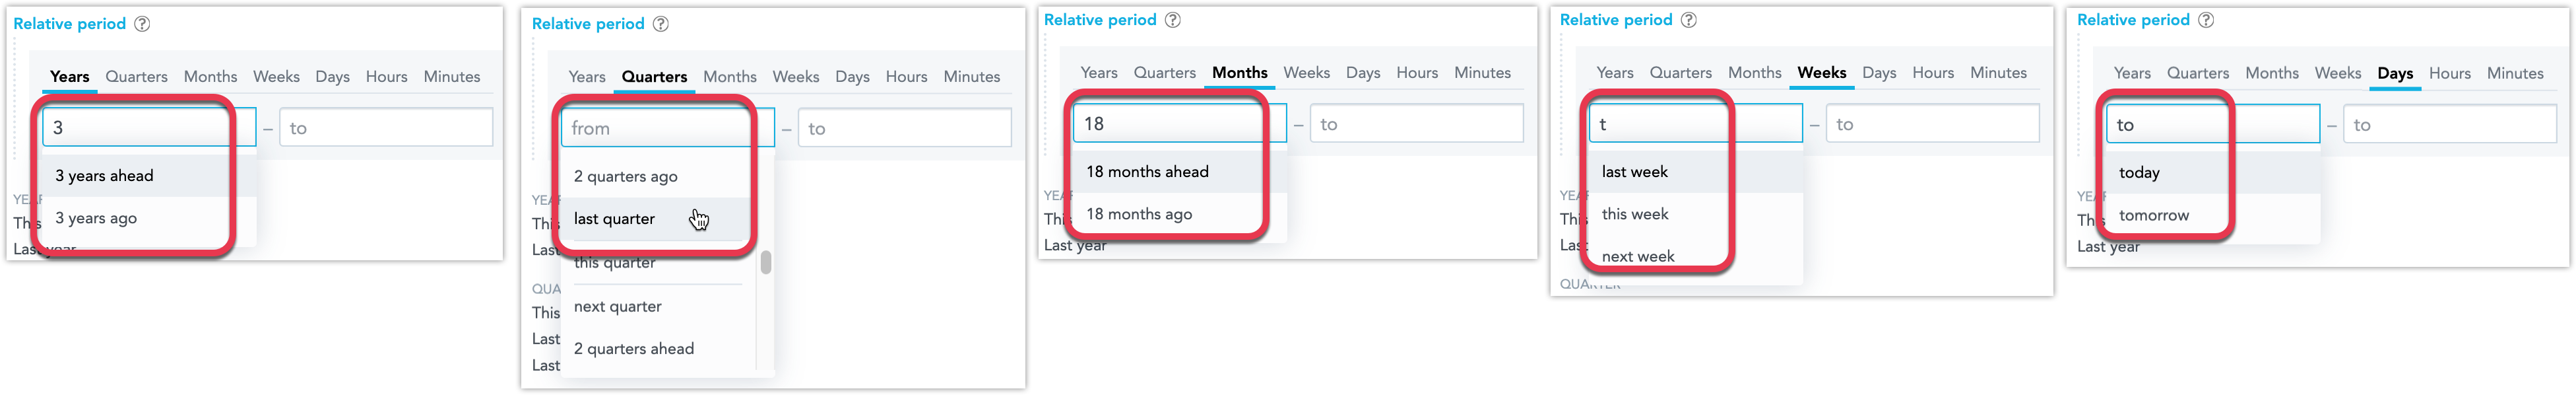
Click Apply.
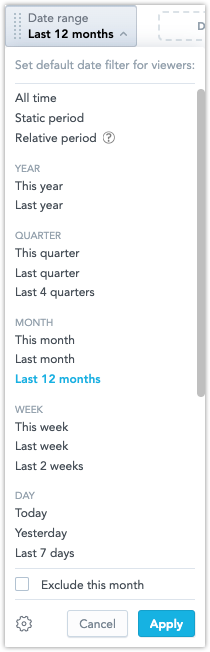
Predefined Periods - Minutes, Hours, Days, Weeks, Months, Quarters, Years
You can filter data by predefined time periods.
Steps:
Click Date range in the top bar.
Select a predefined time period.
(Optional) To exclude data from the current period, select Exclude <period>.
If you want to display average daily revenue from the last 7 days, you exclude today because it contains only incomplete/partial data. The visualization then shows the 7 days before today.
You can only exclude periods that end with the current day, such as
last 7 daysandlast 4 quarters.Click Apply.
Configuration
Click the cogwheel icon to open the date filter configuration dialog.
Mode
Modes control whether users can view and modify the filter. You have the following options:
Interactive
Users can see and freely adjust the filter.
Locked
Users can see the filter but can only use it as it is. Only admins can change its value.
Hidden
Users cannot see the filter, but it is actively filtering the dashboard. Such filter is then marked with an icon in the edit mode.
How Date Filters Interact
When you add visualizations to the dashboards, they are filtered by the dashboard date filter. The visualization may include their own date filters as well (see Create Visualizations).
To disable the visualization filter, unselect the Filter by date option on the right side pane.
| Dashboard filter | Visualization filter | What is used |
|---|---|---|
| ❌ | ❌ | No date filter |
| ❌ | ✅ | Visualization date filter |
| ✅ | ❌ | Dashboard date filter |
| ✅ | ✅ | Dashboard date filter.If the same date dimension is used in both filters. |
| ✅ | ✅ | Both dashboard and visualization date filters (the AND operator).If different date dimensions are used. |