Configure a Dashboard Layout
Dashboard layouts are responsive to prevent the dashboard from being difficult to read on small screens. Dashboards use a predefined set of breakpoints that adjust the layout on display accordingly.

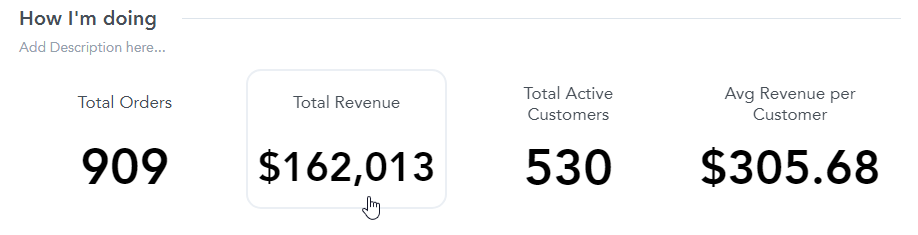
For example, if the size of the screen reaches a breakpoint, the widget (visualization or rich text) from one section may adjust the size and rearrange to two rows.
Dashboard layouts use a 12-column grid. By default, each widget has assigned a specific number of columns. The default height for all widgets is 342px.
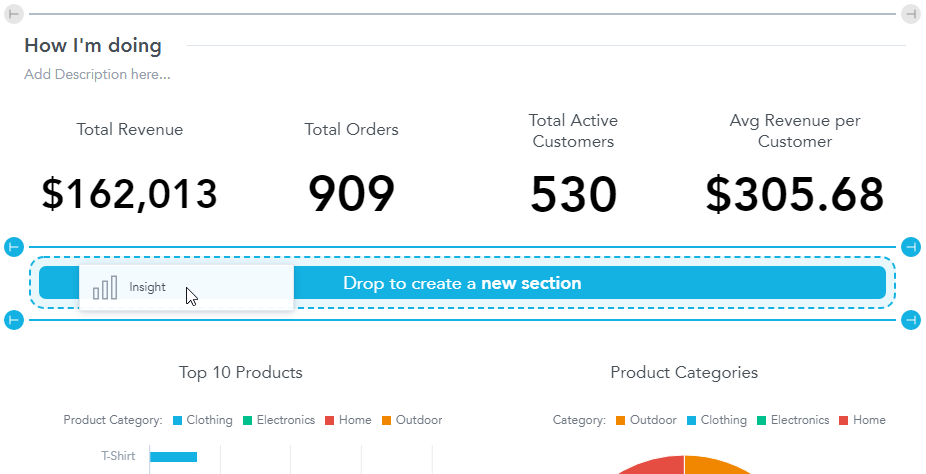
Add Widget to a New Section
To add a visualization to a new section, drag the visualization into the area inbetween sections. As you drag the visualization, the dashboard displays the target place.
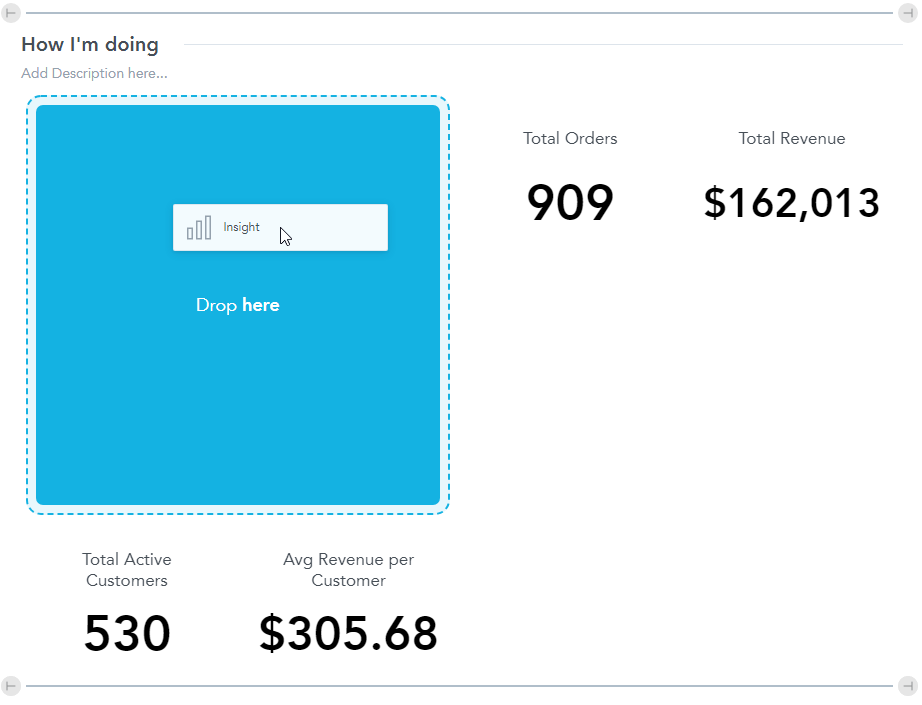
Add Widget to an Existing Section
To add a widget to an existing section, drag the widget into the area within a section. As you drag the widget, the dashboard displays the target place.
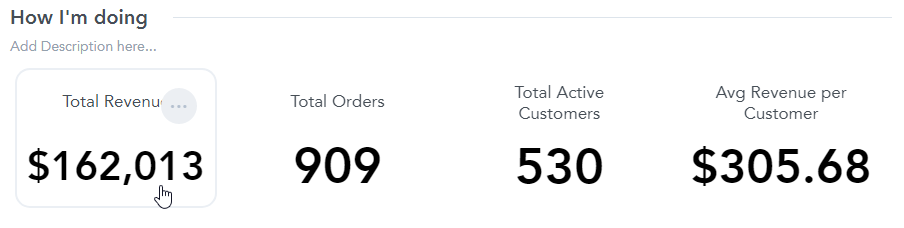
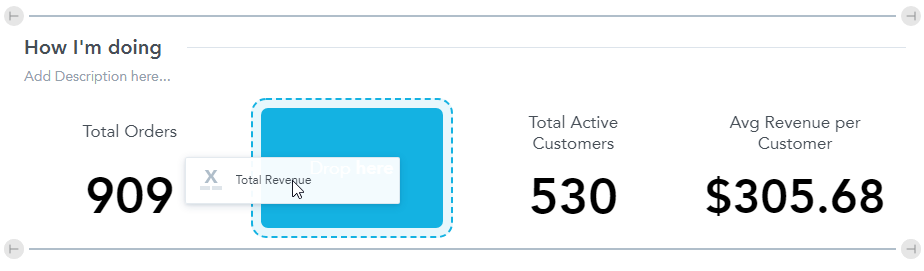
Rearrange Widgets
To rearrange widgets on a dashboard, drag and drop them to a new place. As you drag the widget, the dashboard displays the target place.
Rename a Section
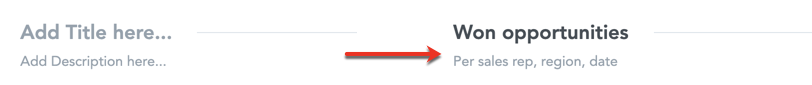
To add a title and/or description to a section of the dashboard, click Add Title here and Add Description here at the top of a section.
The maximum length of the title is 256 characters; the maximum length of the description is 1024 characters.
To hide the title or the description in the View mode, leave it empty when editing the dashboard or click the three dots in the top right corner of the widget and use the Hide title checkbox in the Configuration section.
Adding Widget Tooltips
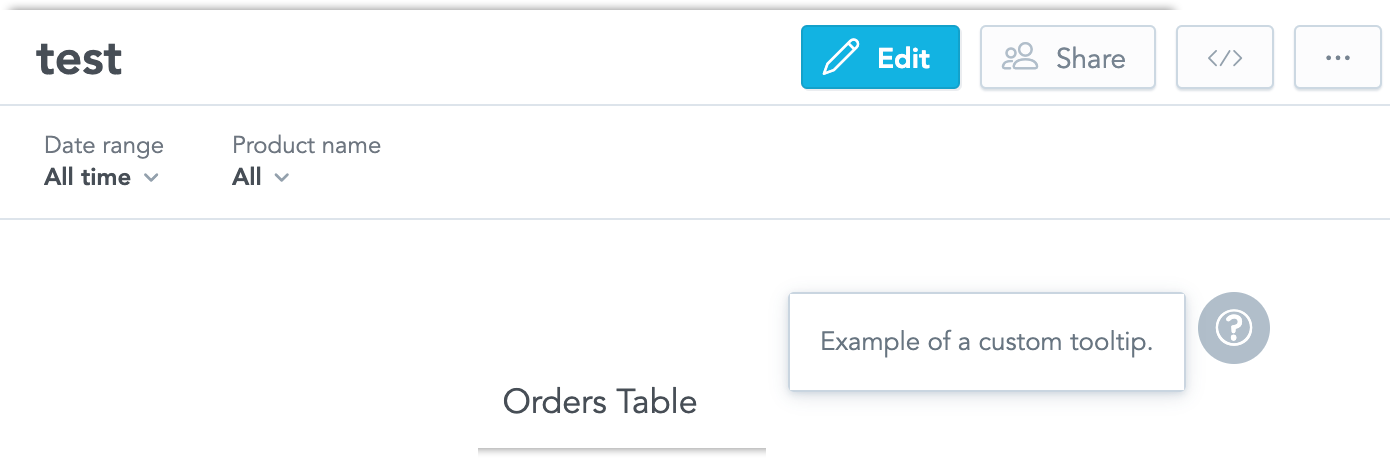
You can enhance your widgets with tooltips that provide additional information. These tooltips appear when you click the question mark icon in the top right corner of the widget while in View mode.
To add a tooltip, follow these steps:
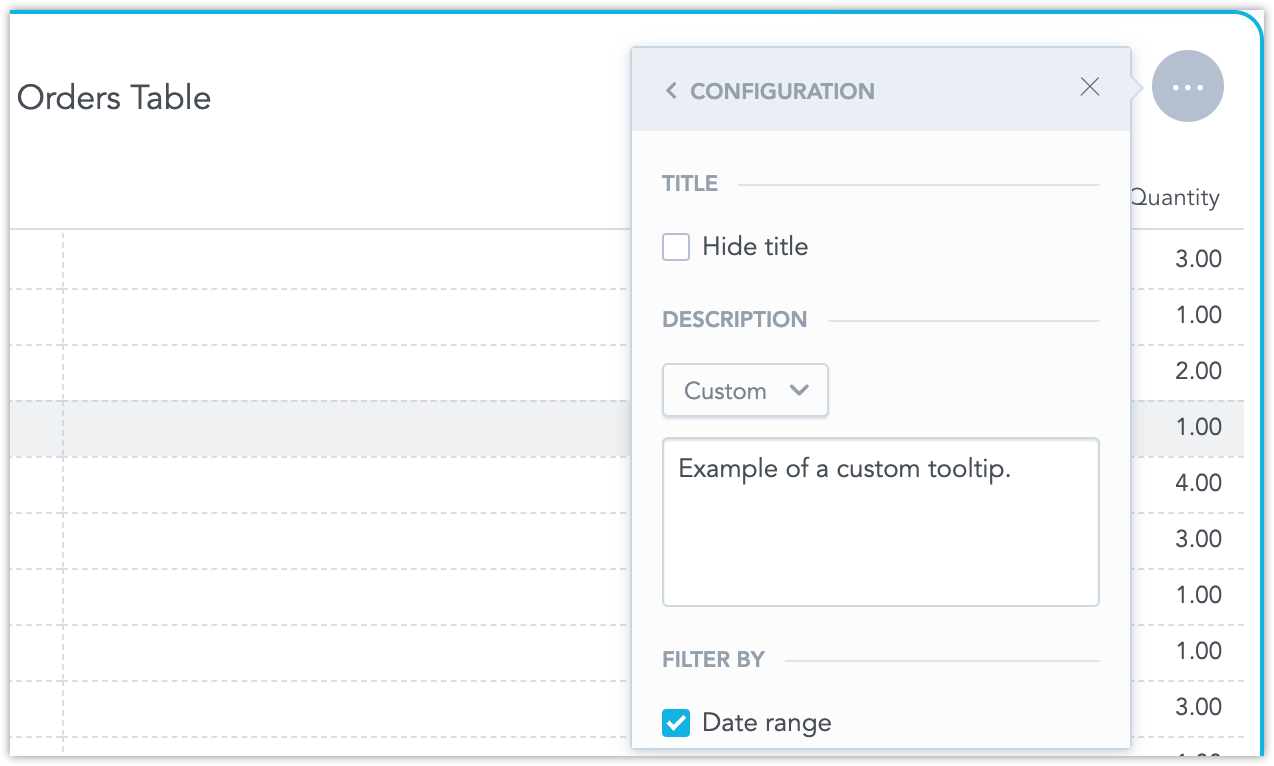
Click the three dots in the top right corner of the widget.
Navigate to Configuration > Description.
Choose from the following tooltip options:
- Inherit: The tooltip content is taken from the underlying visualization.
- Custom: You can override the visualization’s content and display a custom tooltip specific to the widget.
- None: No tooltip will be displayed.
Resize Widgets
All widgets have a minimal width for better visibility and readability.
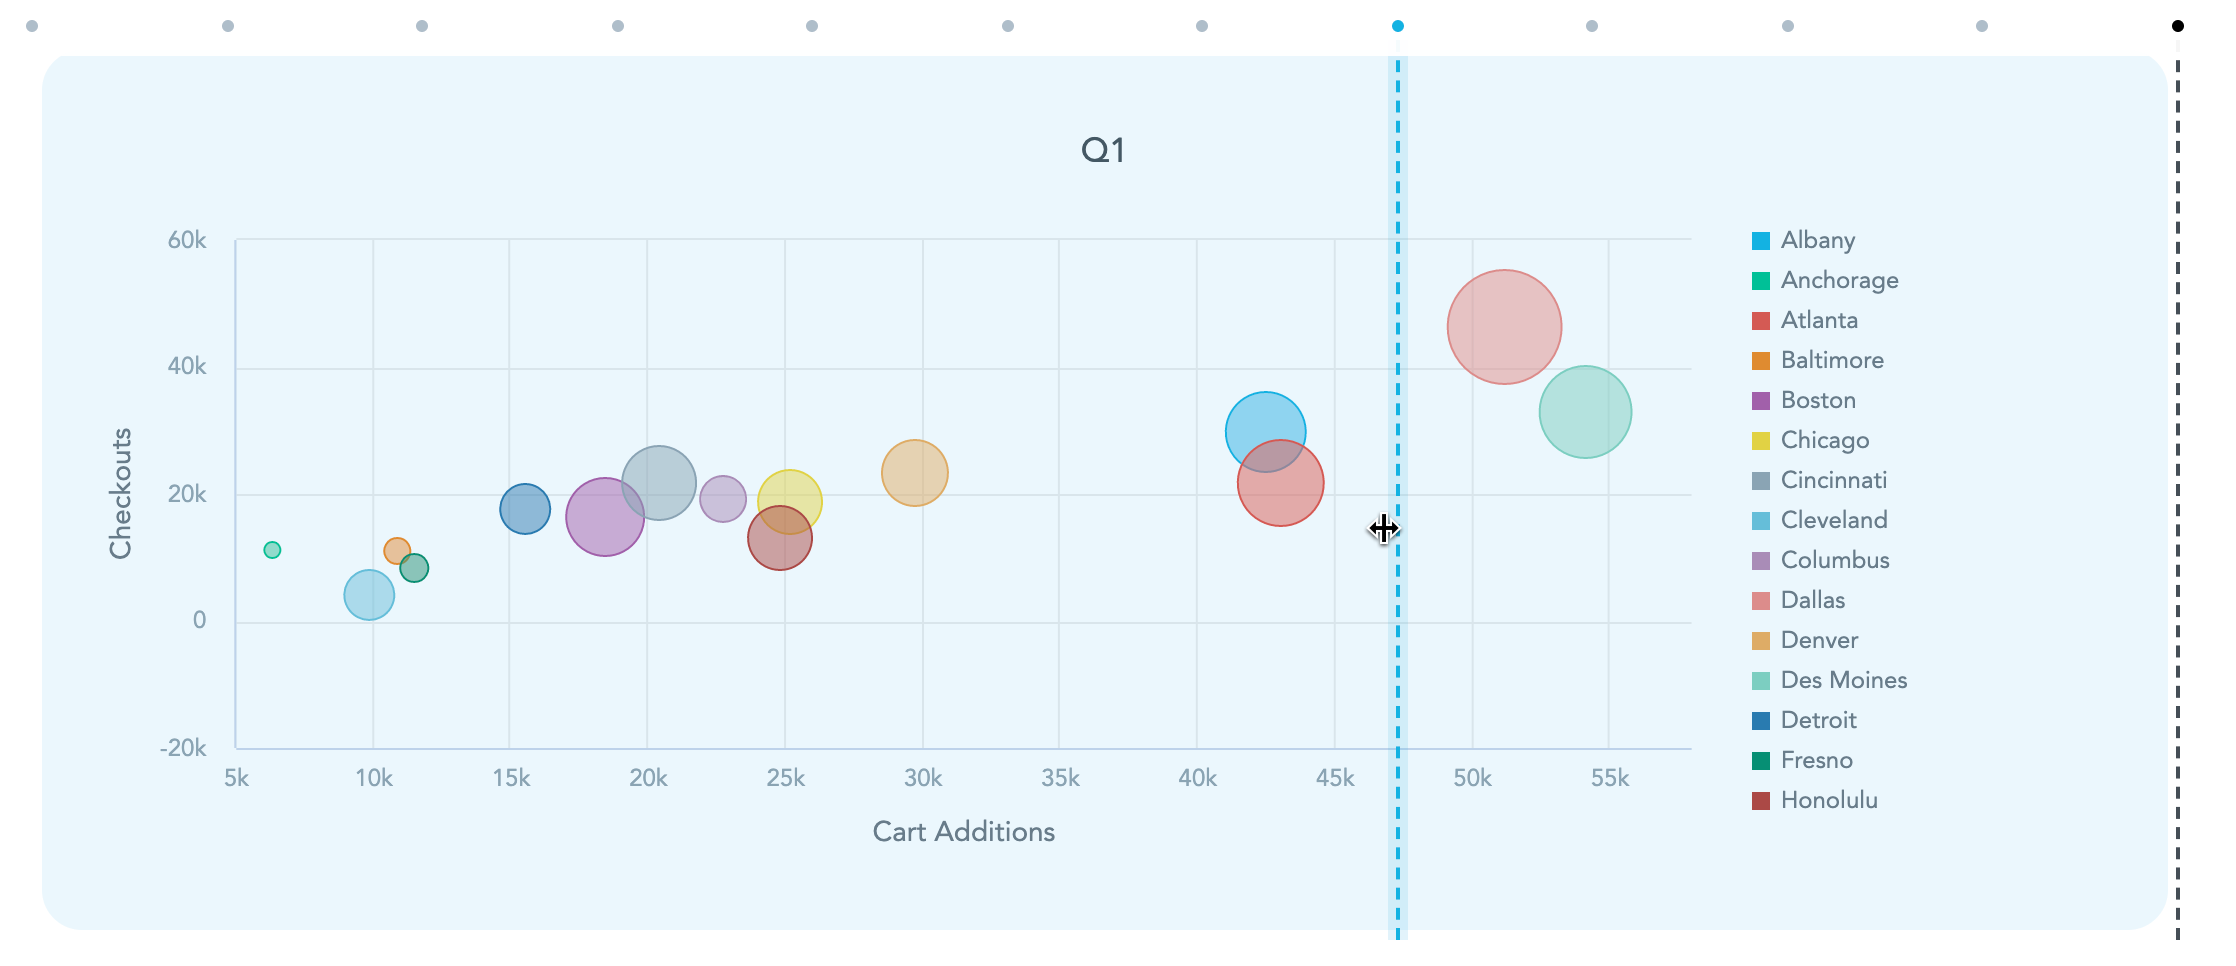
You can adjust the size of the widgets on a dashboard to suit your needs. To change the width, drag the right end of the widget to adjust the width (the number of columns it occupies).
Resizing Pivot Tables
If you add a pivot table to your dashboard, you can adjust the width of the table’s columns directly on the dashboard. When you save the dashboard, the column widths are preserved.
Dashboards do not change the widget itself, only one particular instance. If your dashboard includes multiple instances of the same widget or if you have the widget on multiple dashboards, you must adjust the width in each instance.
Small tables are automatically resized to fit the whole width of the widget.